Active Directory (AD) is a directory service developed by Microsoft.
It is used by most companies to manage identities, user accounts, machines, security policies, and access rights to resources and services.
However, its strategic position makes it a prime target for attackers and Red Teams. Compromising Active Directory generally provides almost unlimited access to the network. As a result, it is often subject to numerous attacks, particularly due to companies’ negligence in implementing hardening measures.
It should also be noted that, by default, after installation and deployment, AD offers very little or no protection. For example, it was only very recently that Microsoft decided to enforce security mechanisms such as SMB Signing for machines running Windows 11 and LDAP Signing for Windows Server 2025 by default.
In this context, it is essential to implement increased monitoring, coupled with customised detection rules, in order to quickly identify suspicious behaviour and respond before it turns into a major security incident.
In this article, we will review the threats to Active Directory as well as Red Team techniques and tactics. We will also detail best practices for AD monitoring to enable you to prioritise log collection, identify ‘weak signals’ and transform these signals into detection rules.
Practical Guide to Active Directory Monitoring
Understanding Threats to Active Directory and Red Team Tactics
Red Team exercises and real attacks against Active Directory almost always follow the same logic: reconnaissance, credential collection, exploitation, and persistence.
Understanding these steps and the associated techniques is essential for prioritising data collection, defining relevant alert thresholds, and transforming ‘noise’ into actionable signals.
What are the main techniques targeting Active Directory?
Techniques targeting AD range from passive enumeration to more intrusive actions on domain controllers.
Among the most common are mass enumeration of accounts and relationships (often automated via mapping tools such as BloodHound), attacks on Kerberos such as Kerberoasting or AS-REP abuse for accounts without pre-authentication, attempts at replication or exfiltration via replication APIs (DRSUAPI/DCSync), and ACL/GPO manipulation to gain persistence.
In addition to these techniques, there are methods for reusing credentials (pass-the-hash, NTLM relay) and producing or manipulating Kerberos tickets (Silver/Golden Tickets) to bypass normal authentication.
Finally, modern attacks often combine several steps: LDAP/SMB reconnaissance to build an attack graph, followed by precise targeting of service accounts or sensitive objects.
The interest for a security team is to recognise the behavioural signatures of these techniques. These are not isolated patterns but chains of events (enumeration spikes, abnormal Kerberos requests, repeated access to sensitive objects, ACL modifications) which, taken together, make sense.
We will not go into detail about these different techniques here. For more information, please see our full article on Active Directory security. In it, we review common vulnerabilities and attacks, as well as configuration flaws that can compromise AD security.
Attackers’ and Red Teamers’ objectives
The objectives pursued are generally limited to a few goals: obtaining high privileges (compromising administrator accounts or a domain controller), establishing discreet persistence, and preparing for exfiltration or lateral propagation.
The pace of the attack varies: reconnaissance is often ‘noisy’ (massive enumerations, LDAP/SMB scans over a short window) while the stealth phases are ‘quiet and slow’. These may include sporadic attempts to steal tickets, gradual ACL changes, use of compromised accounts at odd hours, etc.
Some techniques, such as Kerberoasting, generate an observable spike in TGS requests for a service account; others, such as DCSync, manifest themselves through specific actions on domain controllers and access to replication interfaces that are not common in normal operation.
For detection, it is crucial to distinguish between reconnaissance (volume and patterns) and post-exploitation (status changes on AD objects, account creation/modification, replication operations). The former often alerts to an attempt to identify targets, while the latter indicates progress towards actual compromise.
Which indicators should guide Active Directory monitoring?
Rather than listing isolated technical rules, it is better to focus on correlated signals and the data to be collected. Elements to monitor include:
- The volume and rate of LDAP requests by source and target (peaks or repeated requests with broad filters are typical of enumeration);
- Kerberos anomalies: unusual number of AS/TGS requests for the same principal, AS requests without pre-authentication for accounts configured without pre-authentication, or a high number of tickets requested for service accounts;
- Repeated authentication failures on sensitive accounts or outside normal hours of activity;
- Access and operations on replication or DRS interfaces (unusual actions performed from non-administrator accounts to domain controllers);
- Changes to ACLs or privileged objects (creation/deletion/modification of accounts, rights escalation on OUs or GPOs);
- Sudden emergence of SMB activity/access to sensitive shares outside of known patterns;
- Tooling patterns: very regular and broad LDAP queries, or enumeration volumes typical of mapping tools, and unusual use of service accounts for enumeration operations.
In concrete terms, the value comes from correlation: a spike in LDAP queries followed by abnormal Kerberos requests and an ACL change on a sensitive OU should trigger a priority investigation. Similarly, successful authentications from unusual locations/hosts combined with access to administrative shares are high-criticality signals.
Building on this tactical framework, the rest of the article shifts to operational implementation: the task now is to translate the signals described above into relevant data, audit policies and detection rules.
LDAP Traffic Monitoring
In this section, we suggest you enhance the security of your Active Directory by implementing increased monitoring of LDAP traffic.
To do this, we will rely on event logs. Let’s take a look at this step by step.
Overview of our Active Directory environment
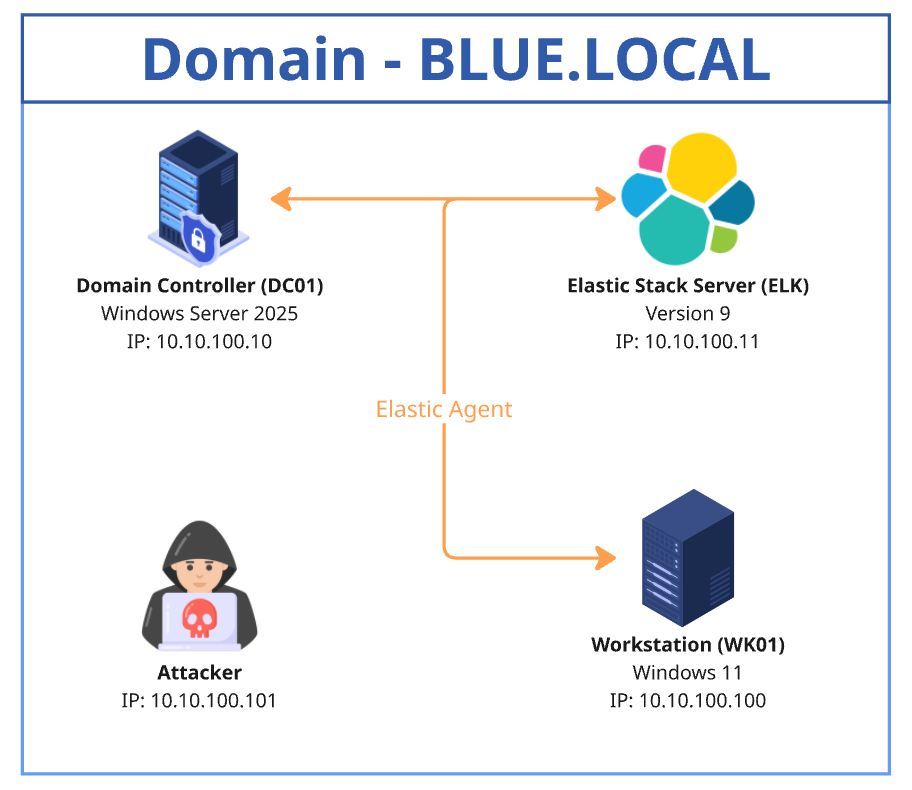
The diagram below shows the Active Directory environment used for this article. It consists of a domain controller (DC01) running Windows Server 2025, a client machine (WK01) running Windows 11, an Ubuntu server hosting ELK version 9, and an attacker machine.
Domain Controller Audit Policy
The Domain Controllers Audit Policy plays an essential role in defining and monitoring events to be audited on domain controllers. It ensures the traceability of sensitive actions and facilitates the detection of suspicious activity.
These actions include user logins, object modifications, unauthorised access attempts, and other critical events.
Each action generates an Event ID that is recorded in the Event Viewer. These logs can then be collected and correlated in a SIEM (such as ELK) to detect security incidents and centralise alert generation.
Setup and configuration
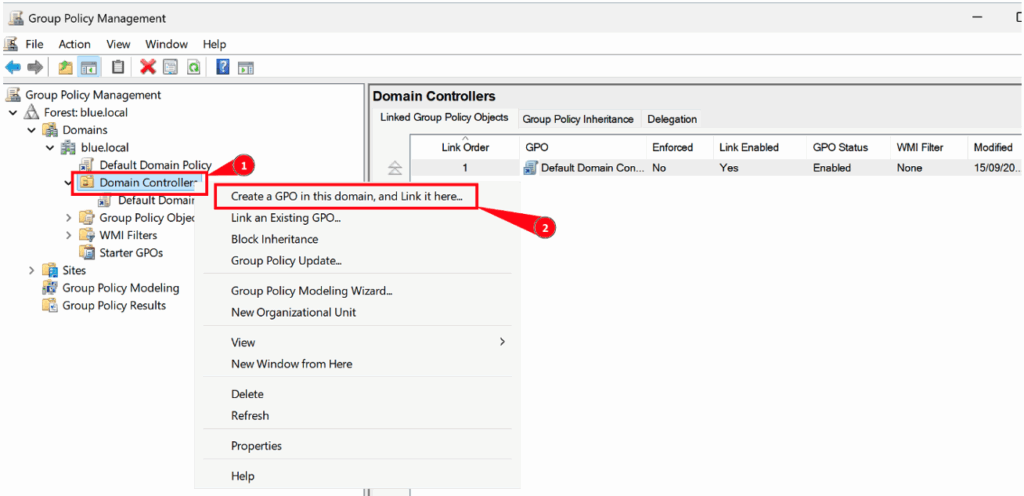
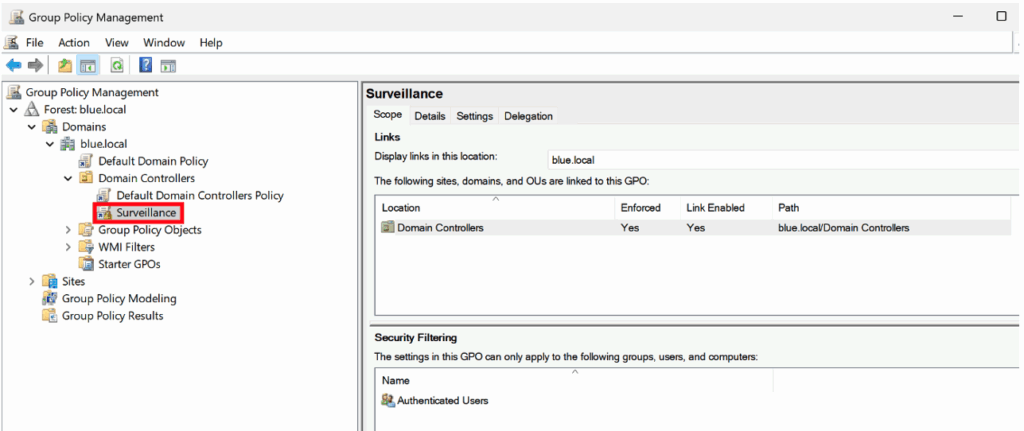
To implement this security policy, it is recommended to create a new dedicated policy that applies specifically to domain controllers.
To configure it, simply access the Group Policy Object (GPO) editor and set the appropriate parameters.
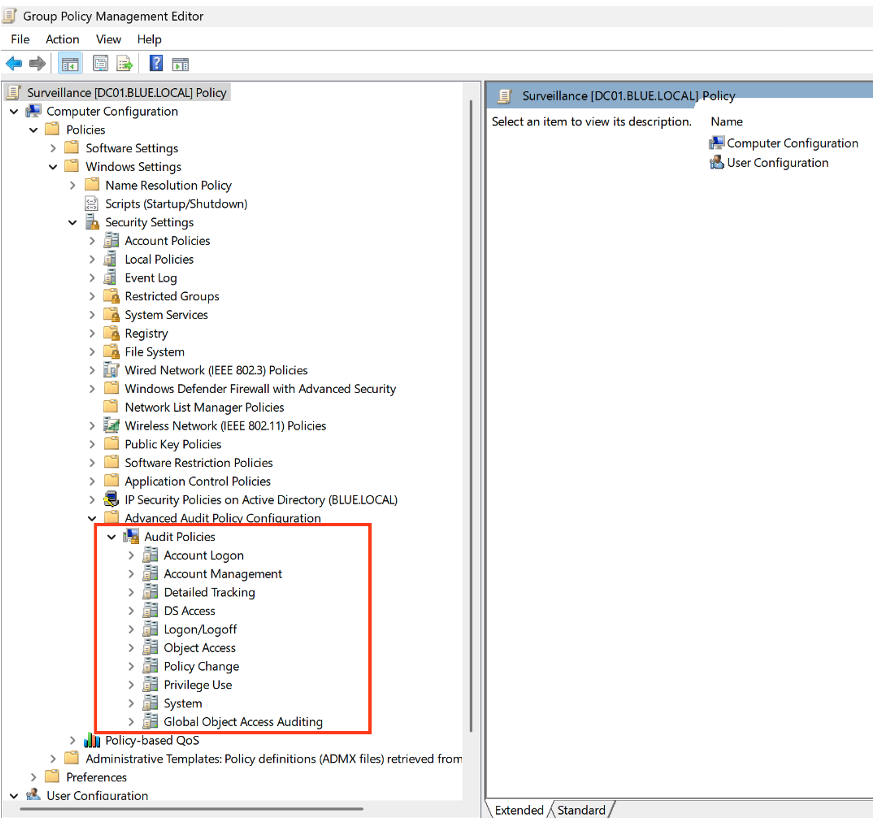
Once the new policy has been created, you can edit it by going to the following path:
Computer Configuration > Windows Settings > Security Settings > Advanced Audit Policy Configuration
This menu offers different audit categories, each corresponding to a specific type of activity. For example:
- Account Logon: allows you to monitor events related to account login attempts.
- Account Management: allows you to track events related to the creation, modification, or deletion of accounts.
The configuration of the different audit categories must be adapted to actual monitoring needs. However, keep in mind that the more detailed and comprehensive the configuration, the more Event IDs it will generate in the Event Viewer, depending on the size of the Active Directory environment.
At the same time, this granularity places an additional load on the SIEM (e.g. ELK), which must have sufficient resources to process and correlate this data.
The table below shows the recommended configuration, specifying the ‘Success’ and ‘Failure’ options to be applied for each category.
| Audit Policy | Subcategory | Triggered event IDs |
|---|---|---|
| Account Logon | Audit Credential Validation | 4776 |
| Account Management | Audit Computer Account Management | 4741, 4743 |
| Account Management | Audit Distribution Group Management | 4753, 4763 |
| Account Management | Audit Security Group Management | 4728, 4729, 4730, 4732, 4733, 4756, 4757, 4758 |
| Account Management | Audit User Account Management | 4726 |
| DS Access | Audit Directory Service Changes | 5136 |
| DS Access | Audit Directory Service Access | 4662 + (requires additional configuration) |
| System | Audit Security System Extension | 7045 |
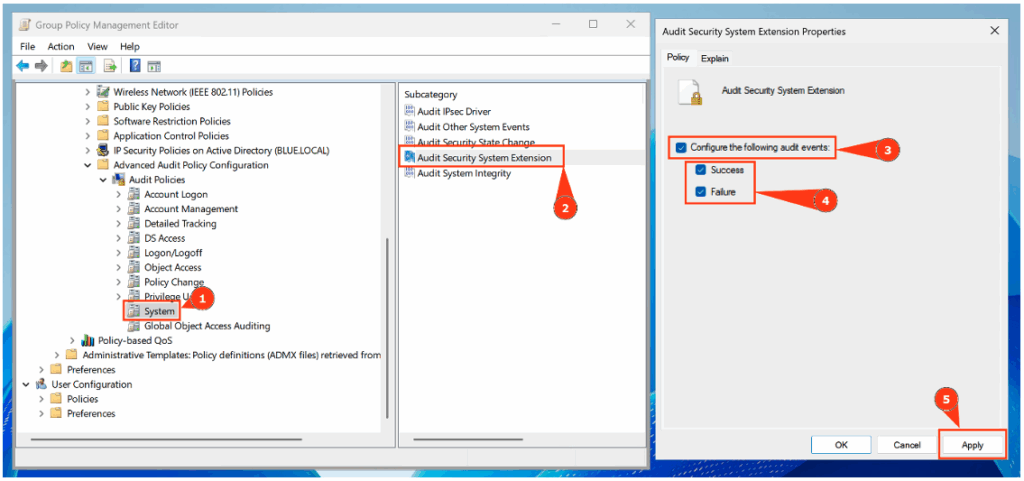
To illustrate, let’s take the Audit Credential Validation subcategory (under Account Logon).
- Double-click Audit Credential Validation.
- Select Configure the following audit events.
- Enable the options for Success and Failure events.
Event visualisation
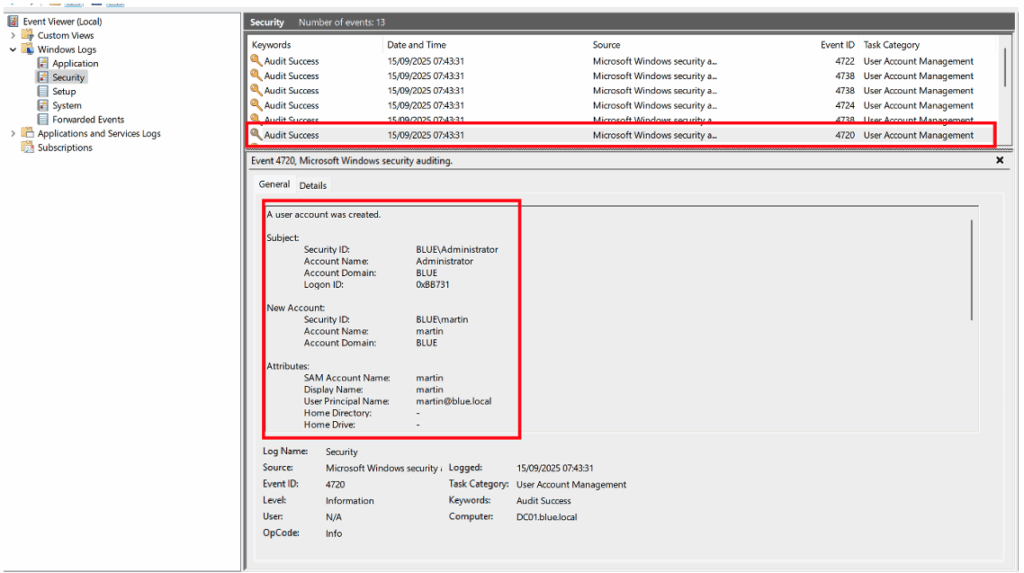
The generated Event IDs can then be viewed in:
Event Viewer > Windows Logs > Security.
For example, the illustration below shows the appearance of Event ID 4720, corresponding to the creation of a user named ‘martin’ by the domain administrator in the Active Directory environment.
Enable NTLM traffic monitoring
In addition to the audit policy applied to domain controllers, it is essential to monitor NTLM traffic in order to detect any suspicious use of this authentication protocol.
Such events may reveal:
- attacks using NTLM relay,
- or misconfigurations allowing the use of NTLM in environments where Kerberos should be preferred.
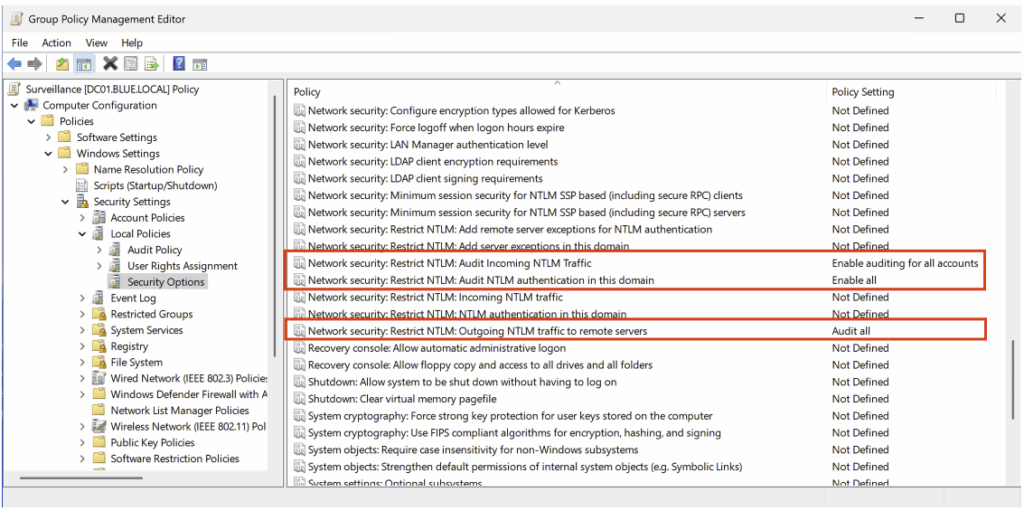
To enable this monitoring, open the policy created previously, then navigate to the following path:
Computer Configuration > Policies > Windows Settings > Security Settings > Local Policies > Security Options
The recommended configuration is shown below.
| Security policy settings | Value |
|---|---|
| Network security : Restrict NTLM : Outgoing NTLM traffic to remote servers | Audit all |
| Network security : Restrict NTLM : Audit NTLM authentication in this domain | Enable all |
| Network security : Restrict NTLM : Audit Incoming NTLM traffic | Enable auditing for all accounts |
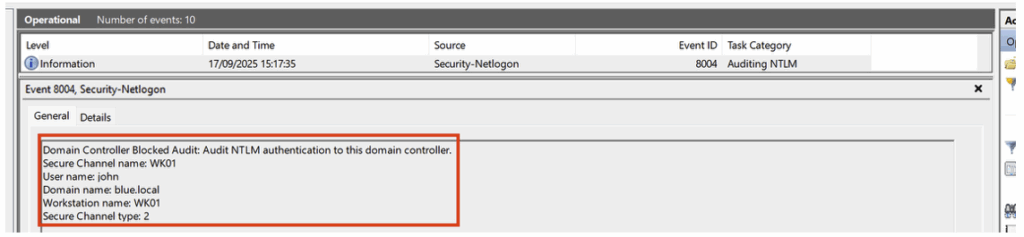
After applying this configuration, the generated events can be viewed in: Event Viewer > Applications and Services Logs > Microsoft > Windows > NTLM.
However, it is important to note that events from the NTLM audit do not provide the identity of the user or the origin of the machine that used the LDAP protocol.
To obtain this information, it is necessary to correlate with Event IDs 4776 in the Credential Validation category.
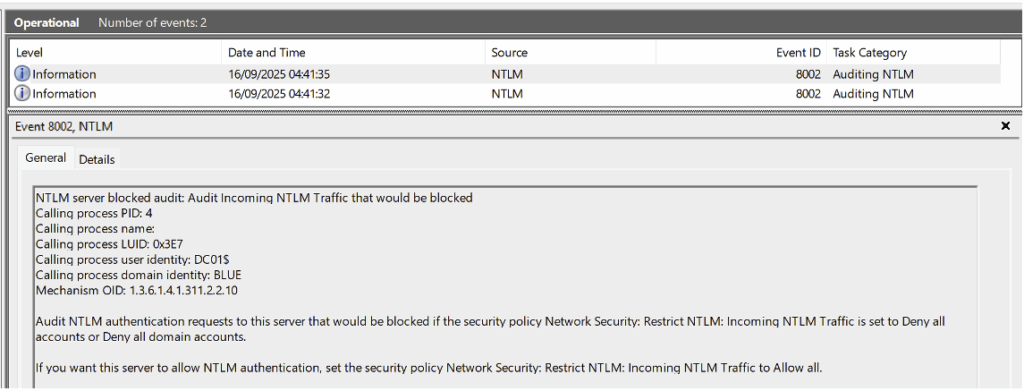
However, for other protocols such as SMB, the NTLM audit does generate an event that includes the full authentication details.
Auditing Active Directory objects
The System Access Control Lists (SACLs) feature allows you to define, for each Active Directory object (user, group, computer, organisational unit, etc.), the types of access that must be logged.
Depending on the configuration, events generated with ID 4662 provide valuable information, such as:
- the identity of the user who accessed (or attempted to access) the object,
- the type of operation performed (read, modify, delete, etc.),
- and the result of the operation (success or failure).
Once collected in a SIEM (e.g. ELK), these events can be correlated with detection rules to quickly identify suspicious activity.
Implement a domain-level SACL
Configuring a SACL requires the Directory Service Access Audit policy to be enabled beforehand, which was done in the previous step with the DS Access audit policy.
In the example shown, we apply object security auditing to the entire domain. However, in a real-world context, and as illustrated later in the article with the creation of custom rules for ELK, it is not recommended to apply it globally. It is preferable to target specific objects such as a user, group, or organisational unit (OU).
To implement this configuration, use the Active Directory Users and Computers administration tool, then access the domain properties.
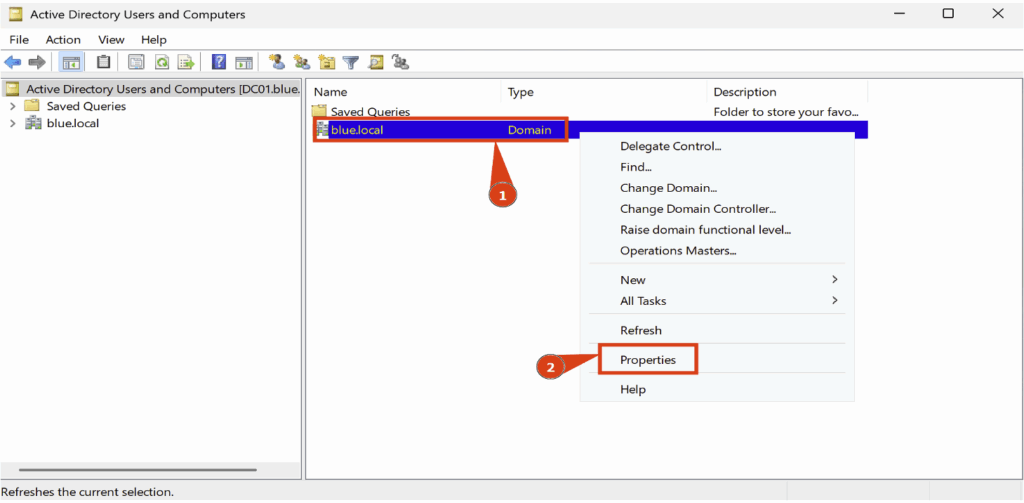
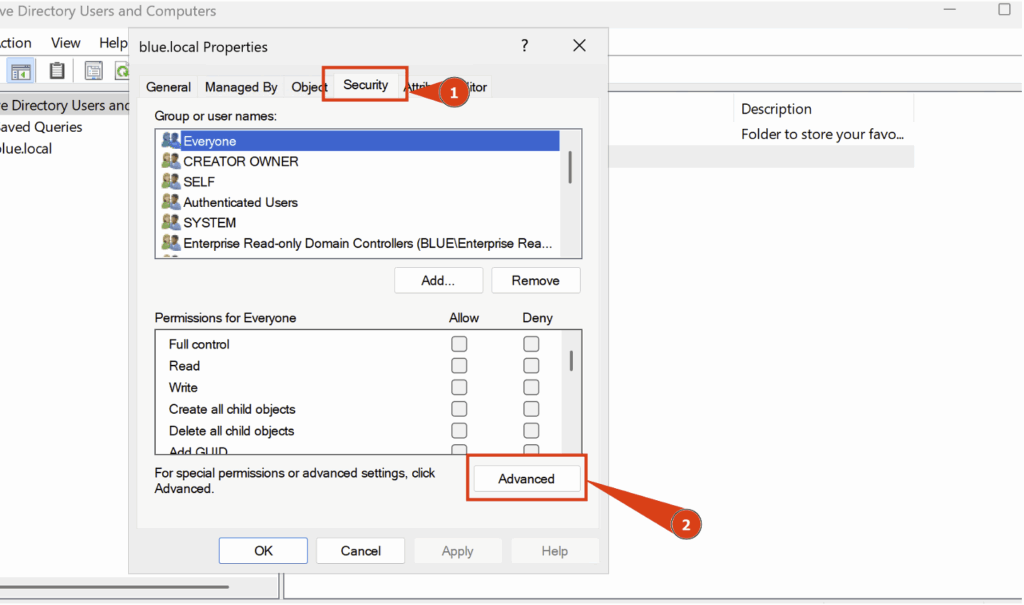
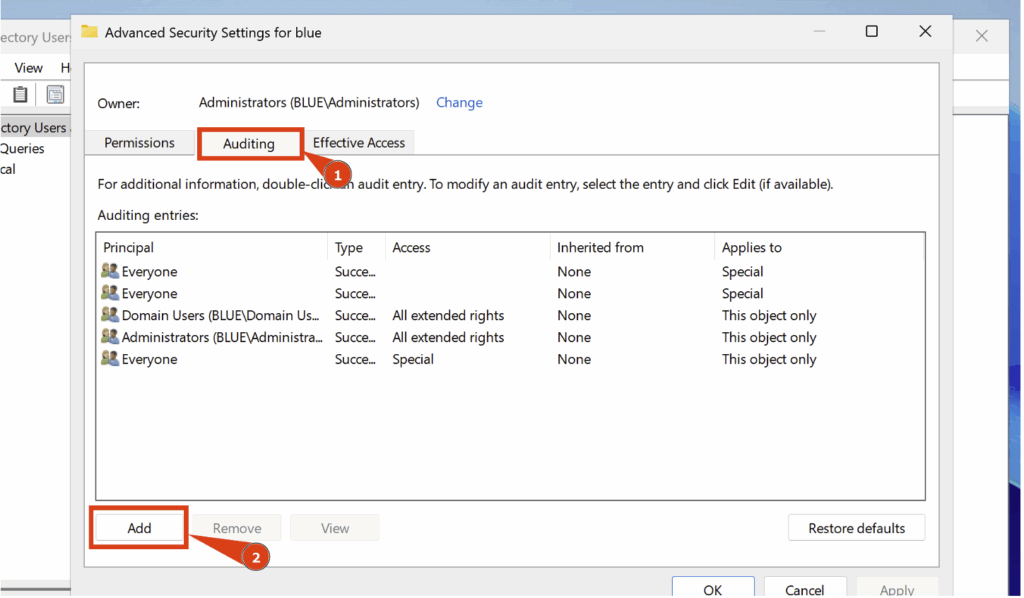
In the Domain Properties tab, open the Security section, then click Advanced.
A new tab will appear, giving you access to advanced security options.
Here, go to Auditing and click Add:
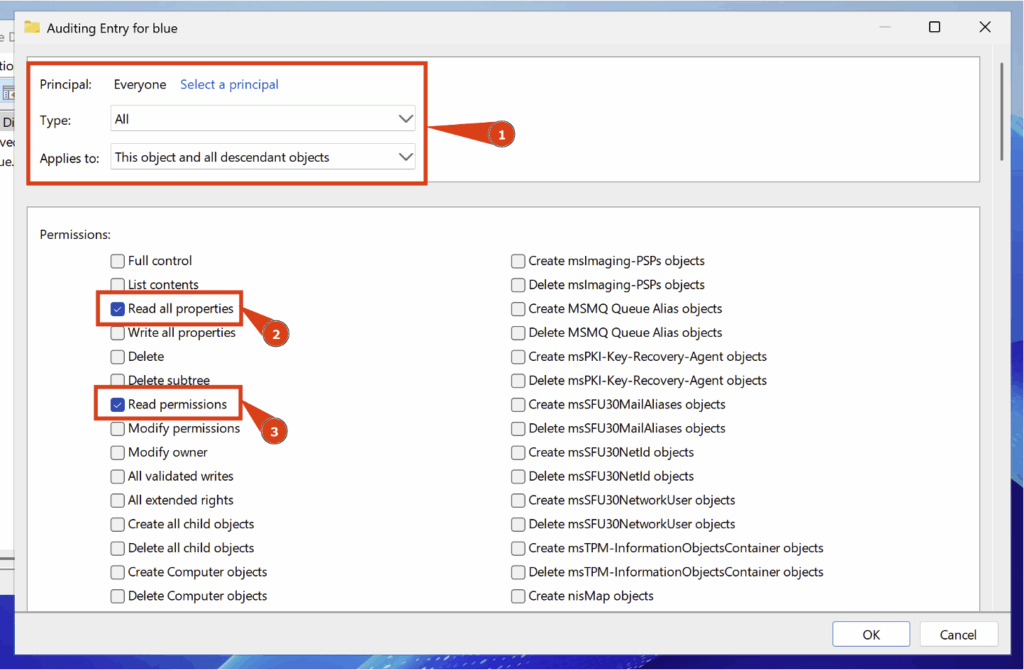
Then configure the following settings:
- Principal > Everyone
- Type > All
- Applies to > This object and all descendant objects
You must also check the following two boxes: Read all properties and Read permissions:
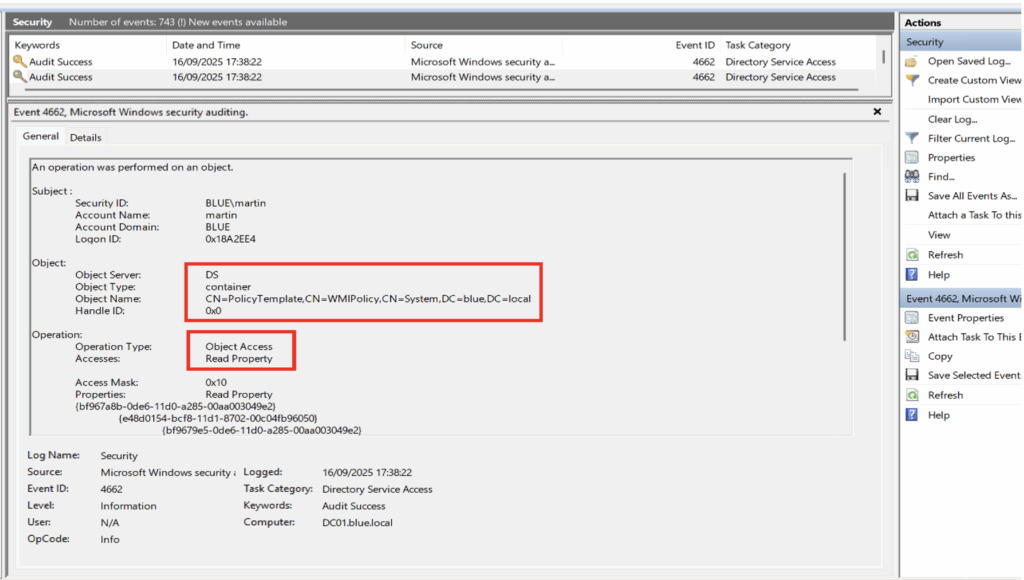
With this configuration, a Security Event ID 4662 will be generated when a member of the Everyone group attempts to read a property of an Active Directory object.
In the example below, the user ‘martin’ performed an extraction from Active Directory using the SharpHound tool. This action resulted in the generation of numerous 4662 events, each corresponding to a read access on a specific object.
Here is an example illustrating this behaviour with a container-type object:
Implementing extended LDAP monitoring
By default, LDAP queries are not logged on a domain controller.
To enable this feature, you must modify the following registry key and assign it a value of 5:
HKEY_LOCAL_MACHINE\SYSTEM\CurrentControlSet\Services\NTDS\Diagnostics\Field Engineering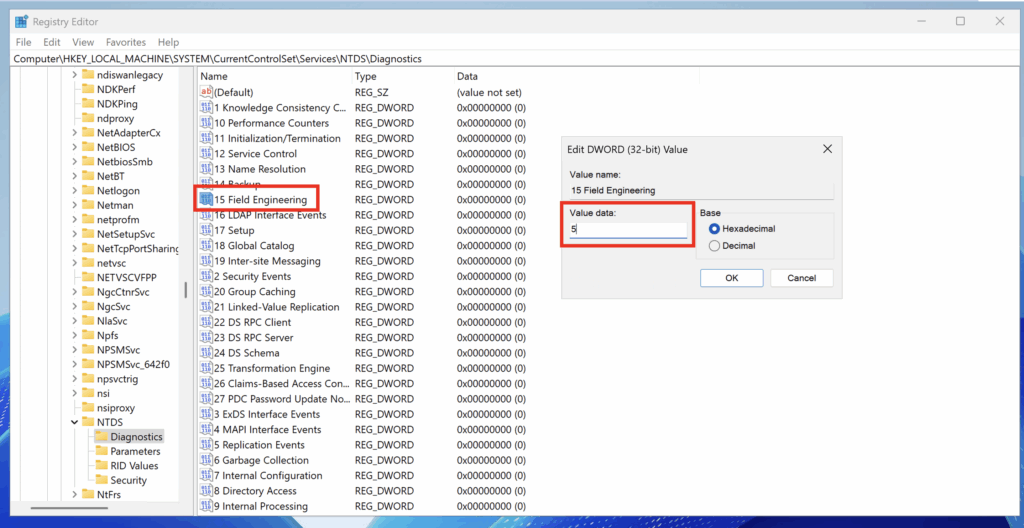
After enabling logging, only certain LDAP queries are recorded by default. This feature was originally designed to identify queries that are considered costly or inefficient.
The default thresholds are as follows:
- Expensive Search Results Threshold (10,000): An LDAP query is considered expensive if it traverses more than 10,000 entries.
- Inefficient Search Results Threshold (1,000): an LDAP query is considered inefficient if it searches more than 1,000 entries and the results represent less than 10% of the entries visited.
- Search Time Threshold (30s): An LDAP query is classified as expensive or inefficient if it takes more than 30 seconds to execute.
These thresholds can be adjusted by creating specific registry keys and assigning lower values for more granular monitoring.
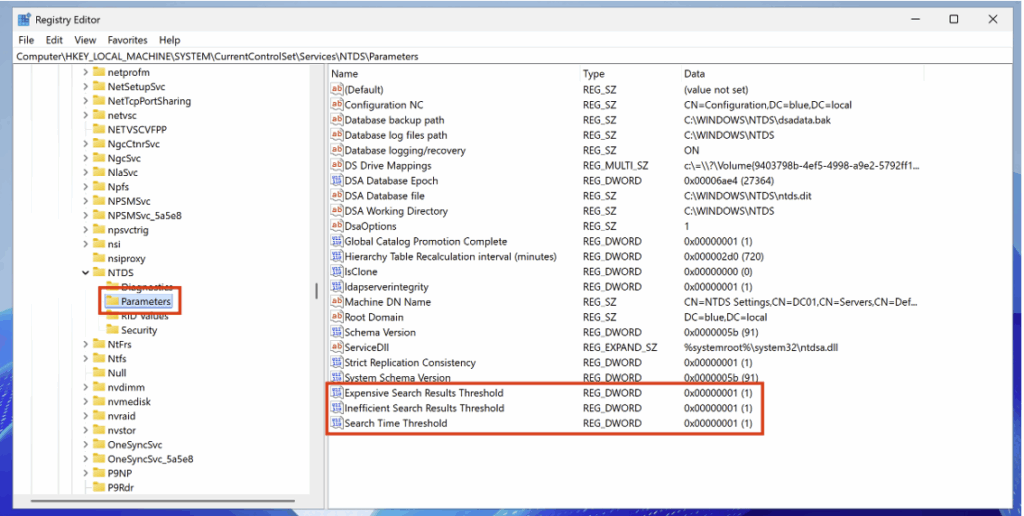
For complete logging of all LDAP queries, set the value of each threshold to 1.
| Registry path | Type | Value |
|---|---|---|
HKEY_LOCAL_MACHINE\SYSTEM\CurrentControlSet\Services\NTDS\Parameters\Expensive Search Results Threshold | DWORD | 1 |
HKEY_LOCAL_MACHINE\SYSTEM\CurrentControlSet\Services\NTDS\Parameters\Inefficient Search Results Threshold | DWORD | 1 |
HKEY_LOCAL_MACHINE\SYSTEM\CurrentControlSet\Services\NTDS\Parameters\Search Time Threshold | DWORD | 1 |
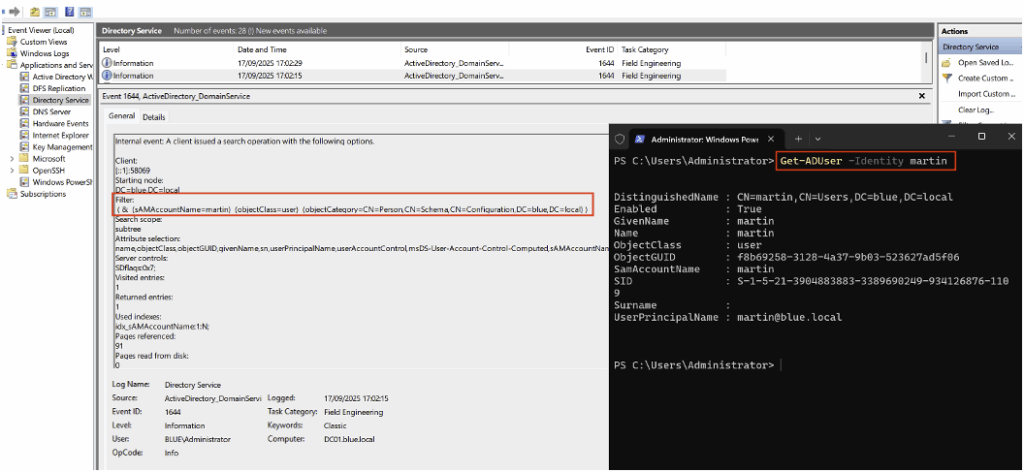
After adding the registry keys with the defined value and restarting the domain controller, the associated events now appear with ID 1644 in the Event Viewer.
They can be accessed via the following path: Applications and Services Logs > Directory Service.
Client-Side monitoring
The domain controller audit policy remains the primary source for LDAP protocol-related events.
However, it is relevant to add client-side monitoring (member machines) to capture LDAP queries issued by these machines: these two approaches form Client-Side Monitoring and improve SOC visibility in addition to controller-side logging.
Unlike the domain controller (where extended LDAP logging is enabled via the Field Engineering registry key to obtain Event ID 1644), member machines use a separate ETW-based event channel: Microsoft-Windows-LDAP-Client.
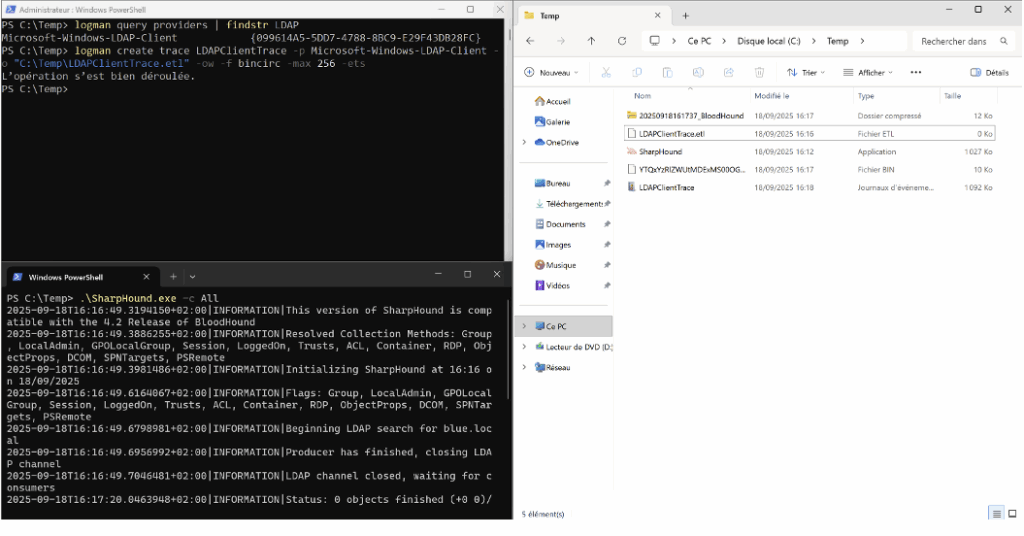
On the client machine, run the following PowerShell command to start an ETW trace and log client LDAP events:
Logman create trace LDAPClientTrace -p Microsoft-Windows-LDAP-Client -o C:\Temp\LDAPClientTrace.elt -ow -f bincirc -max 256 -etsThis command creates a trace named LDAPClientTrace and writes the file C:\Temp\LDAPClientTrace.elt.
To simulate malicious activity from the client machine (e.g., domain ingestion), you can run SharpHound.exe on that machine. The LDAP queries generated by the tool will then be logged in the ETW trace, allowing you to observe client-side behaviour.
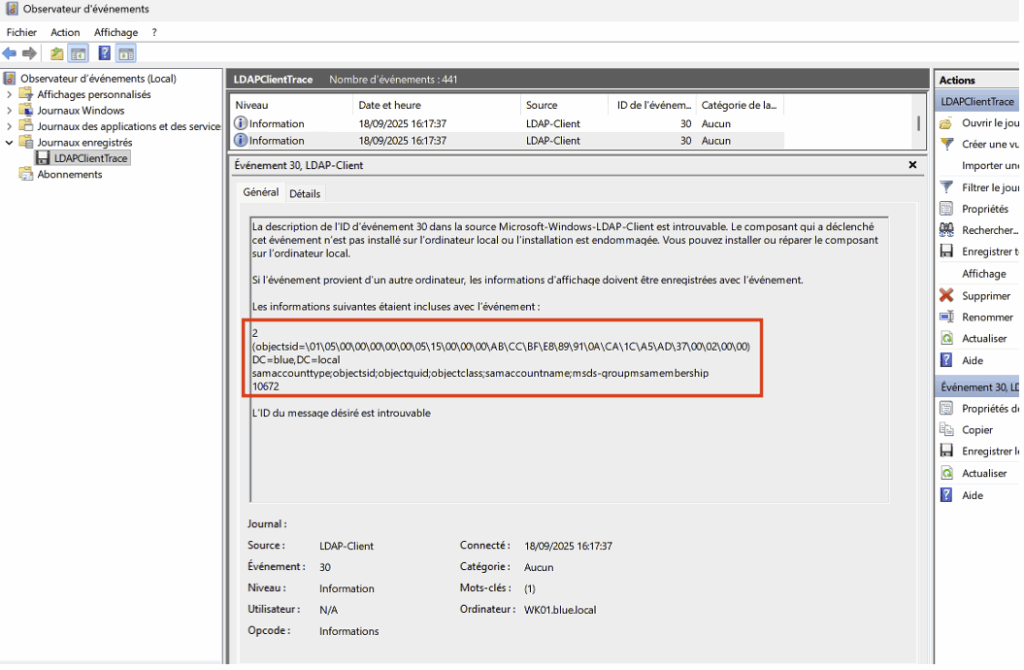
You can import the LDAPClientTrace.etl file into Event Viewer to view LDAP client events, including Event ID 30.
Please note: unlike extended logging on the domain controller side, there are no configurable thresholds (size, duration, number of requests) for this client-side trace.
Furthermore, any use of the wldap32.dll library (called by legitimate or malicious applications) can generate an Event ID 30, which requires correlating these events to distinguish normal traffic from suspicious activity.
To supplement client-side visibility, you can deploy Sysmon with minimal configuration to log all outgoing connections to LDAP (389) and LDAPS (636). This allows you to identify precisely which process on the machine is establishing the connection to the domain controllers.
Example of config.xml file:
<Sysmon schemaversion="4.50">
  <EventFiltering>
    <NetworkConnect onmatch="include">
      <!-- Ports LDAP et LDAPS -->
      <DestinationPort condition="is">389</DestinationPort>
      <DestinationPort condition="is">636</DestinationPort>
    </NetworkConnect>
  </EventFiltering>
</Sysmon>
It can be activated directly via PowerShell:
.\Sysmon64.exe -i .\config.xmlThis command installs Sysmon with the provided configuration and will start logging NetworkConnect events corresponding to LDAP/LDAPS ports.
To test or simulate a malicious scenario from the client machine, restart SharpHound: the generated LDAP/LDAPS connections should appear in the Sysmon events, along with the process that initiated the connection.
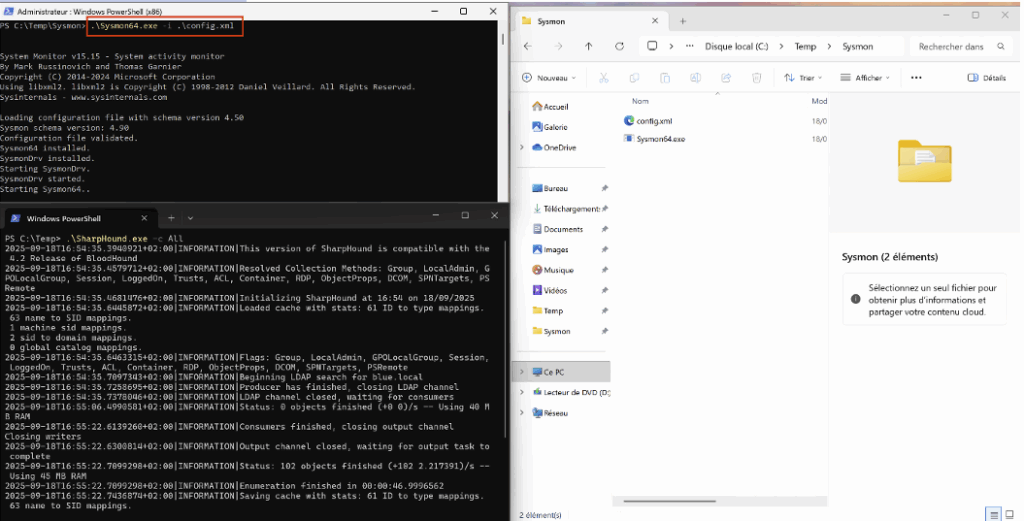
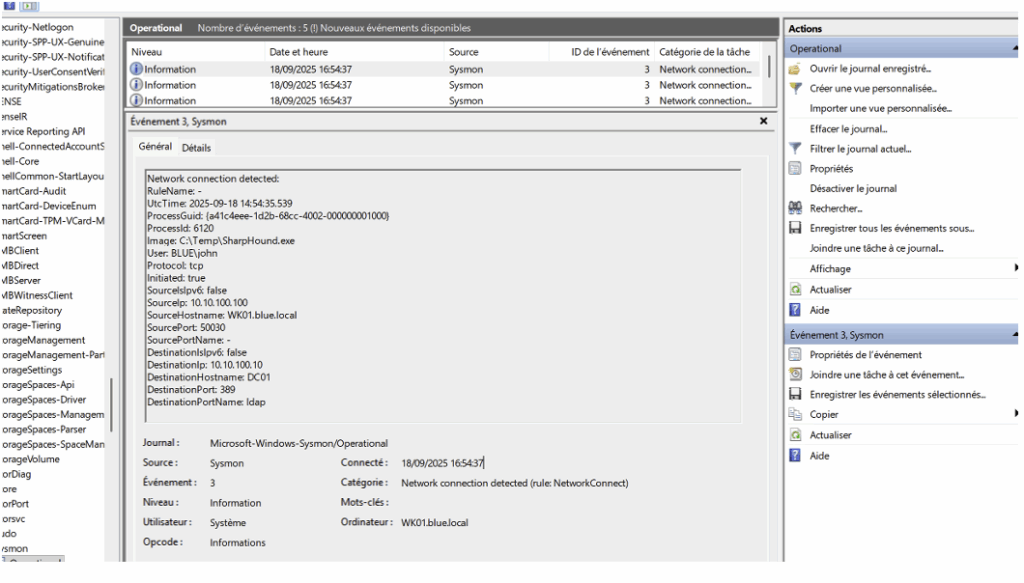
After installation, connections logged by Sysmon appear under Event ID 3 in Event Viewer. You can view them here: Applications and Services Logs > Microsoft > Windows > Sysmon.
These events provide useful information (source process, PID, remote IP address, port, etc.) to identify which process initiated an LDAP/LDAPS connection from the client machine.
Network monitoring
Comprehensive network monitoring usefully complements the visibility obtained from domain controllers and client workstations by capturing network traffic itself, rather than being limited to Windows logs.
It allows you to observe requests exchanged between workstations and servers independently of the logging system, identify abnormal behaviour (e.g. a workstation performing massive directory queries) and enrich investigations by correlating network flows with Windows logs.
Tools such as Zeek, Suricata/Snort or NDR solutions can be used for this monitoring, but several operational limitations must be kept in mind: most LDAP communications used by offensive tools are carried out via LDAP over TLS or LDAPS, which makes the content of requests invisible without TLS inspection (with the technical and legal implications that this entails).
Furthermore, monitoring all LDAP traffic in a large domain can be resource-intensive, so it is essential to position the probe strategically (e.g., upstream of domain controllers or sensitive servers) to maximise the value of the data collected.
In short, network monitoring provides an independent, centralised view that greatly complements Windows audits, but its usefulness will always depend on the specifics of your environment and your infrastructure capabilities.
Create Custom Detection Rules for ELK
Elastic Stack (with Elastic Defend/Detection rules) provides a default set of generic rules, but these are rarely sufficient for in-depth monitoring of LDAP and Active Directory.
In its initial state, only two LDAP-oriented rules are included:
While these rules are a useful starting point, it is advisable to strengthen detection by adding custom rules.
We suggest creating four rules specifically dedicated to malicious activity in Active Directory.
The design of these rules will be based on the elements presented above concerning the configuration and implementation of LDAP monitoring.
ASREProasting Honeypot
AS-REP Roasting is an offensive technique that targets accounts for which the ‘Do not require Kerberos pre-authentication’ option is enabled. The attacker requests an AS-REP for this account and retrieves an encrypted block (the AS-REP), which they can then attack offline using brute force to try to recover the password.
To prepare our honeypot, we start by creating a dedicated account named svc_backup.
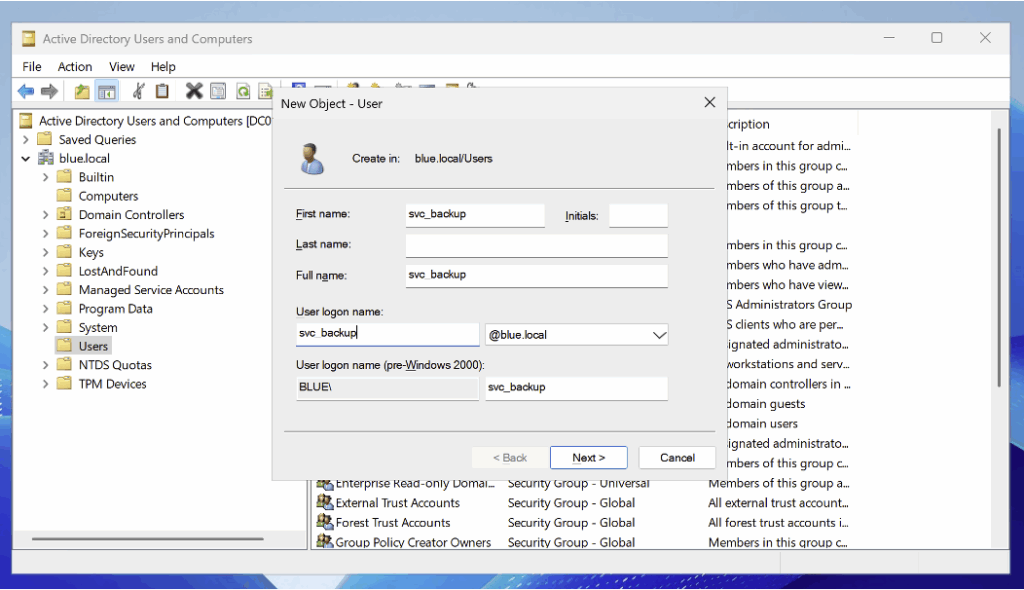
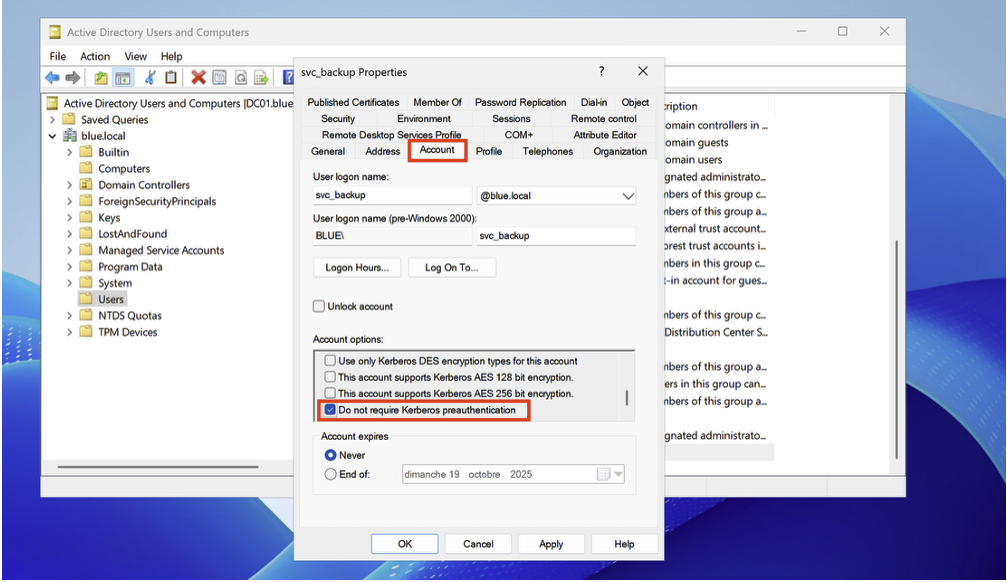
After adding the user, open their properties in Active Directory Users and Computers and tick the option ‘Do not require Kerberos preauthentication’.
To detect Kerberos ticket requests, enable the Audit Kerberos Authentication Service subcategory (under Account Logon) in Success mode in the audit policy.
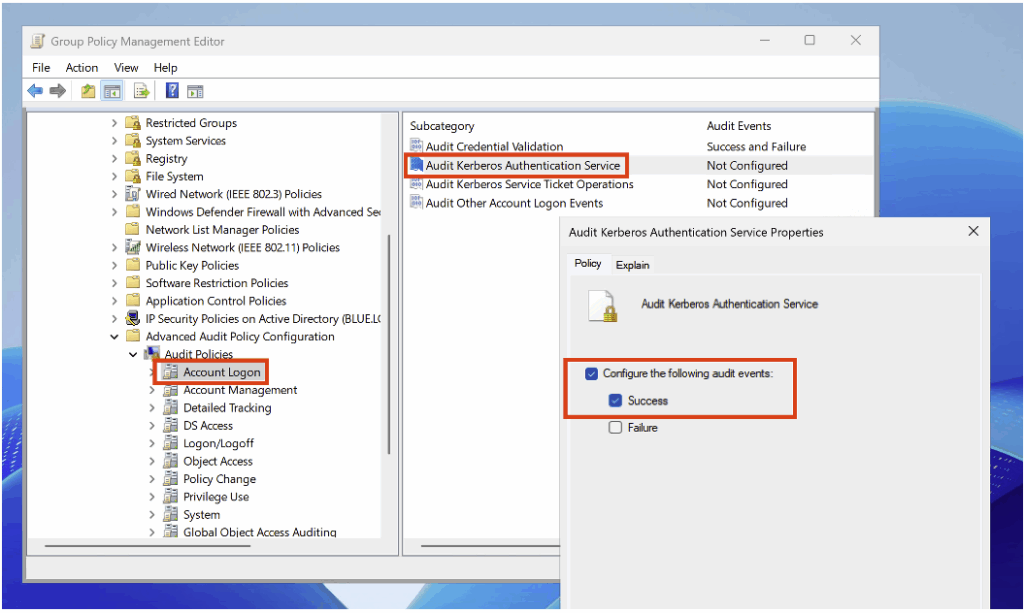
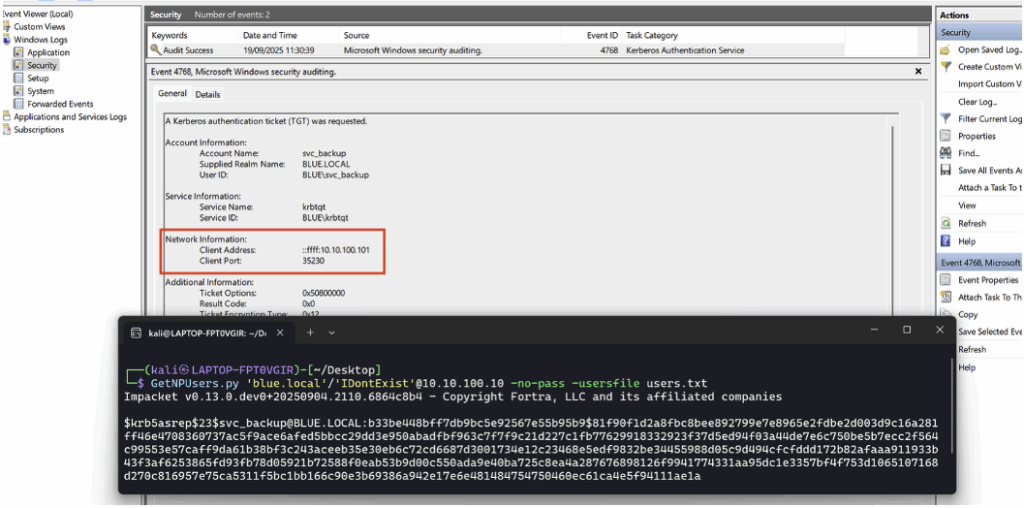
After configuration, when an attacking machine requests the AS-REP Roasting honeypot ticket, an Event ID 4768 is generated.
Among the elements relevant for detection is the IP address of the machine that made the request:
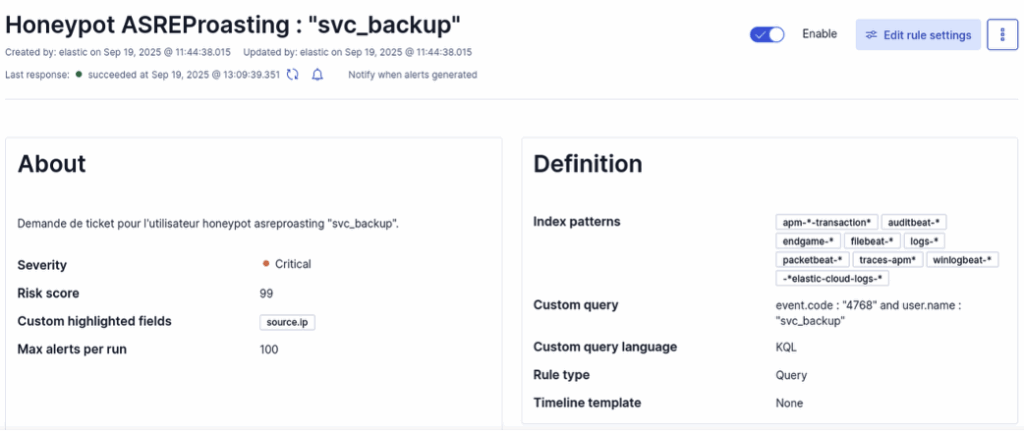
To simply detect the honeypot-related query in ELK, a very concise KQL rule is sufficient.
The following query searches for the Event ID associated with the ticket and the name of the target account:
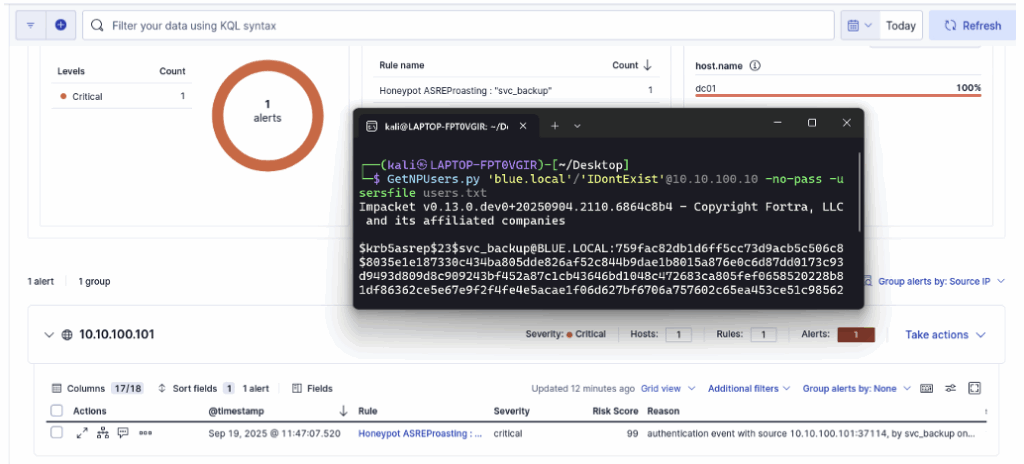
event.code : "4768" and user.name : "svc_backup"This is what the detection rule looks like in the SIEM:
After adding the rule to ELK, restart the attack from the offensive machine; in the dashboard, you will see that the rule has been triggered successfully.
The creation of the rule and the configuration of the account in Active Directory remain deliberately minimalist here. In a real environment, it is advisable to increase the credibility of the account by adding an activity history, consistent attributes and simulated usage to make the decoy more credible and maximise the effectiveness of the honeypot.
Kerberoasting Honeypot
Kerberoasting is an offensive technique where an attacker requests a service ticket (TGS) for an account with the servicePrincipalName attribute.
This ticket contains an encrypted portion derived from the service account password; the attacker retrieves this encrypted block and can then attack it offline using brute force to try to recover the password.
For our honeypot, we start by creating a dedicated account named svc_veeam.
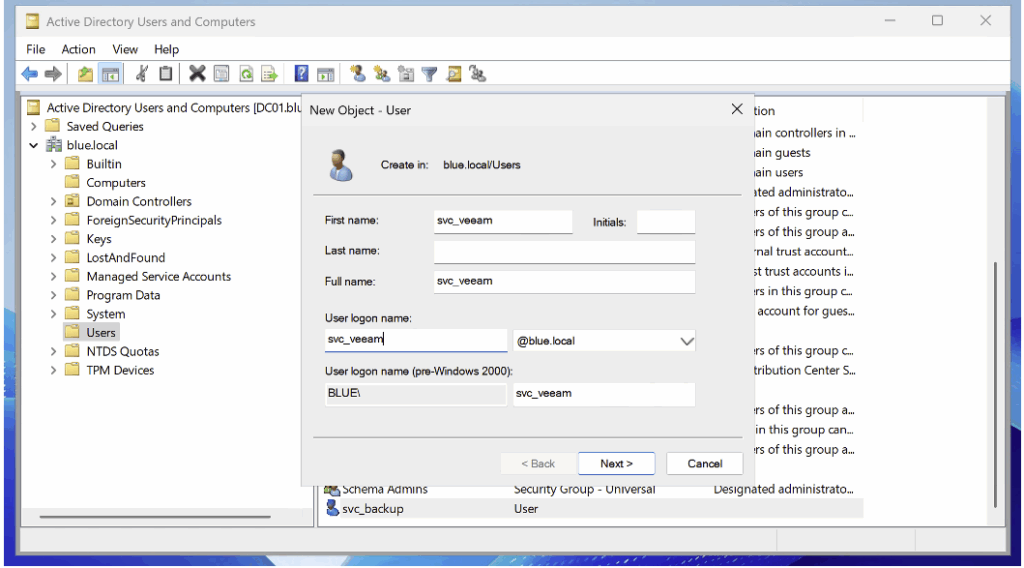
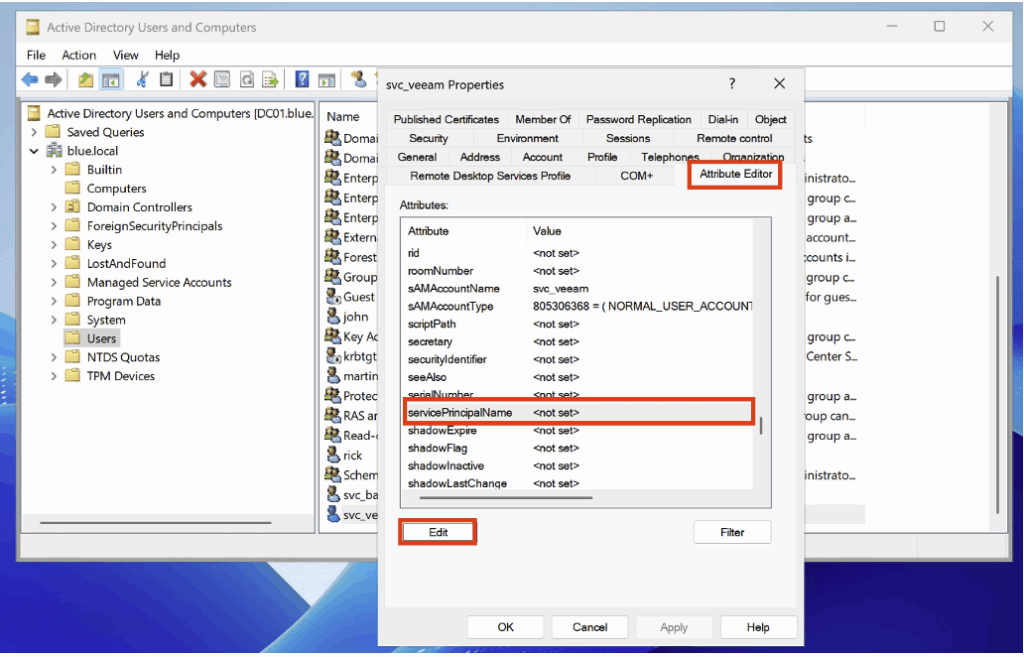
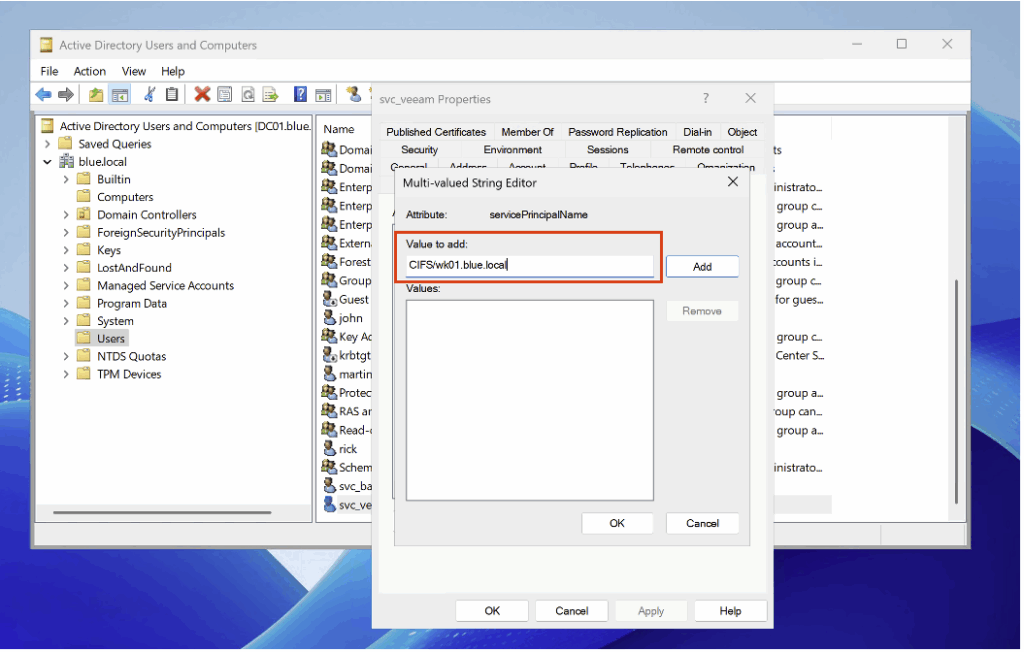
After adding the user, open their properties in Active Directory Users and Computers and assign them a servicePrincipalName (SPN).
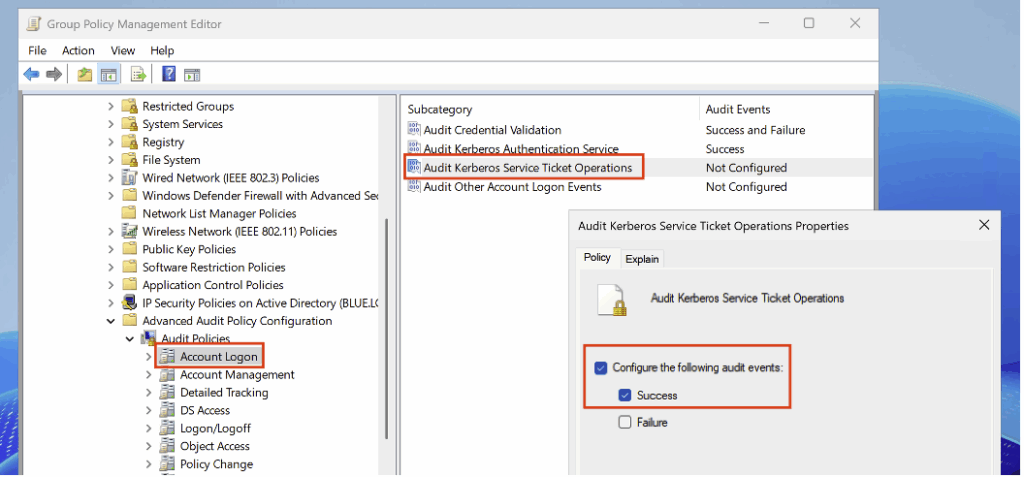
To detect ticket requests related to a servicePrincipalName, enable the Audit Kerberos Service Ticket Operations subcategory (under Account Logon) in Success mode in the audit policy.
After configuration, when an attacking machine requests the Kerberoasting honeypot service ticket, an Event ID 4769 is generated.
Useful information for detection includes the targeted account and the IP address of the machine that made the request.
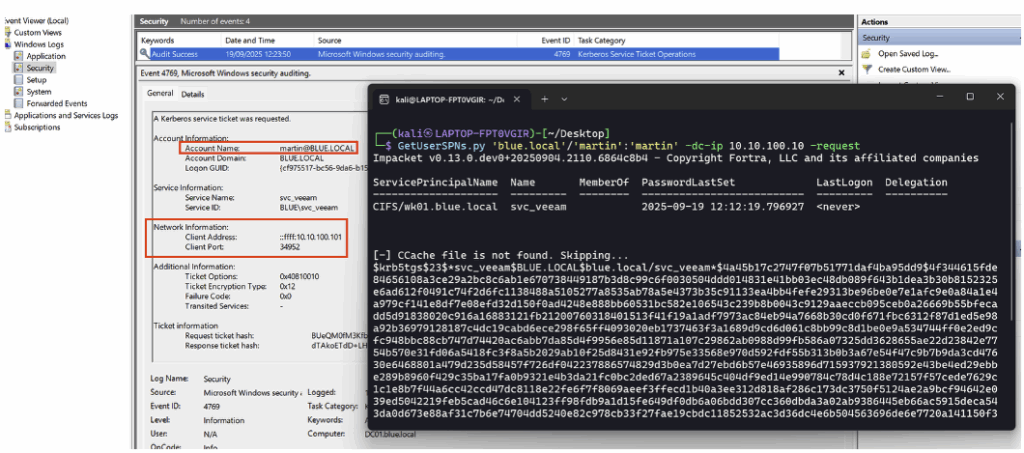
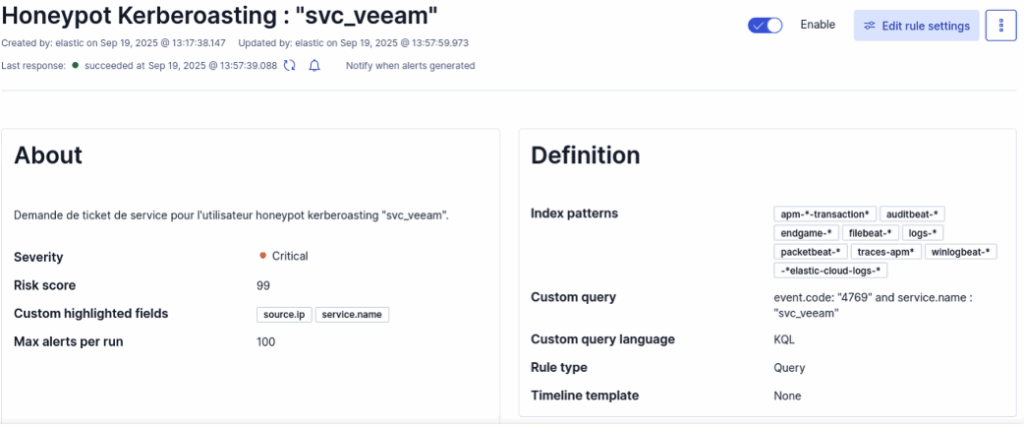
To easily detect a Kerberoasting query targeting the honeypot in ELK, a concise KQL rule is sufficient. The query below searches for the Event ID corresponding to the service ticket request and the name of the targeted service:
event.code : "4769" and service.name : "svc_veeam"This is what the detection rule looks like in the SIEM:
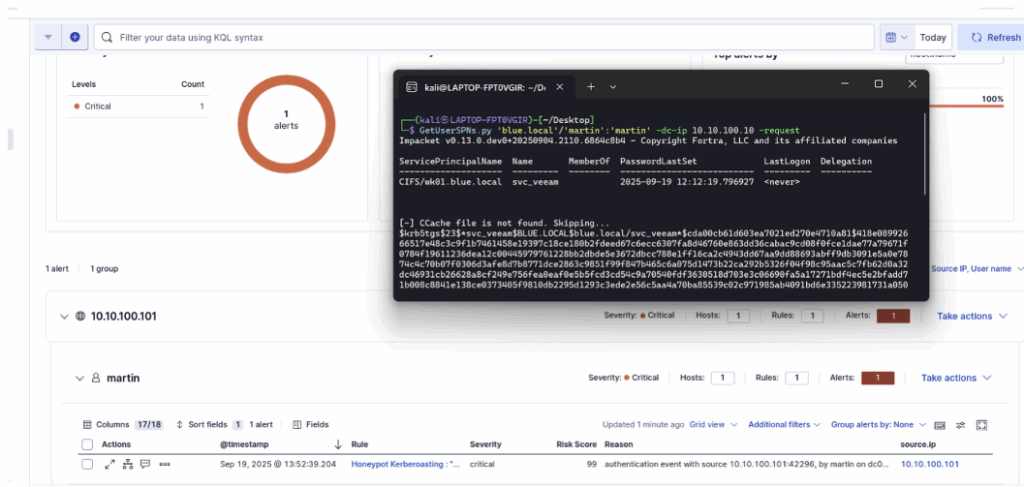
After adding the rule in ELK, restart the attack; the dashboard will show that the rule has been triggered successfully.
The configuration of the detection rule and the setup of the account in Active Directory presented here are deliberately minimalist.
In production, it is necessary to increase the credibility of the account by assigning it an activity history, consistent attributes, and simulated usage to make the decoy more realistic and maximise the effectiveness of the honeypot.
BloodHound detection via SMB (IPC$ & named pipes)
BloodHound is an offensive tool designed to map relationships and permissions within an Active Directory.
In our case, with extended LDAP monitoring enabled, we used SharpHound.exe, the ingestion tool associated with BloodHound.
For the detection rule presented here (and the next one), however, we are interested in the external tool bloodhound-python. When configured in All mode (a common scenario), the tool connects to the IPC$ share to establish DCE/RPC sessions and queries several named pipes exposed by the system via this channel, including srvsvc, samr, and lsarpc.
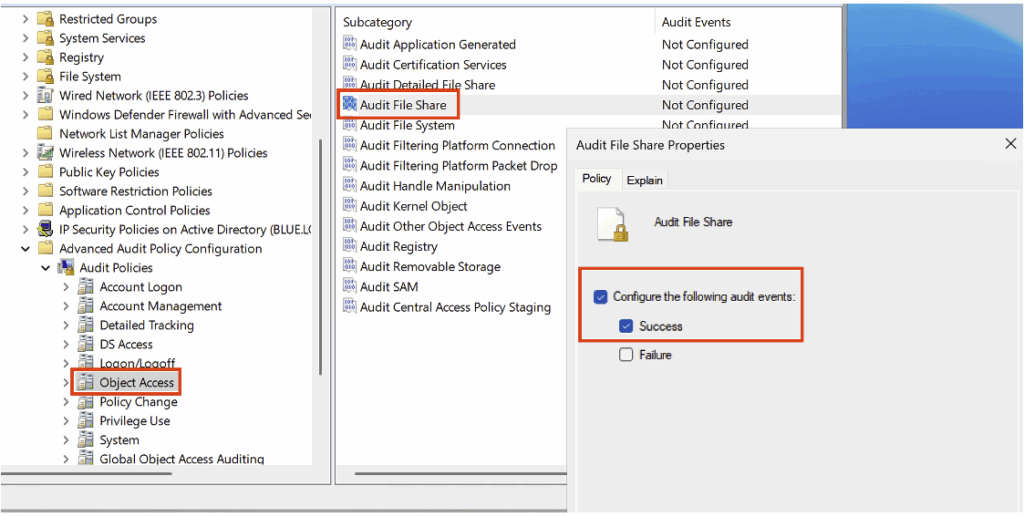
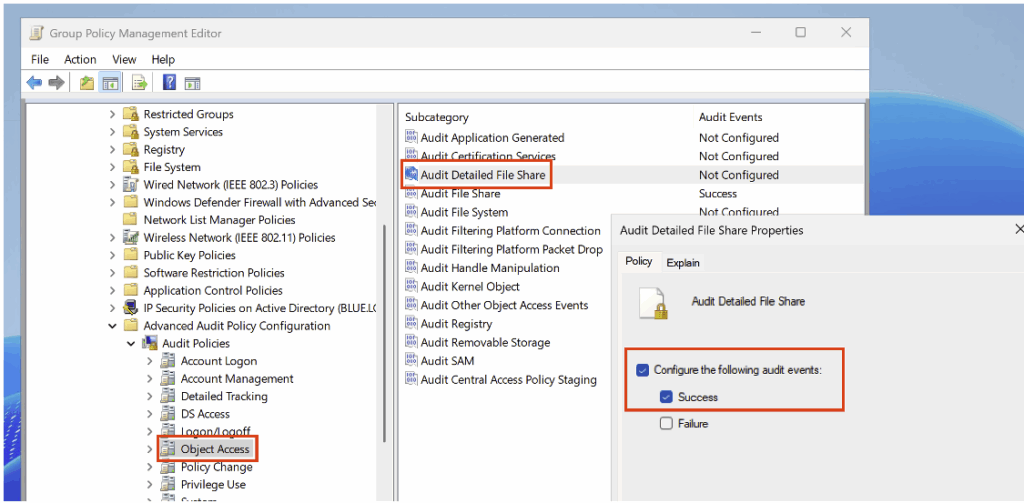
To create the detection rule, you must first identify the Event IDs corresponding to access to the share and access to named pipes; this requires enabling the Audit File Share subcategory in Success in the audit policy, located in the Object Access category.
Also enable the Audit File Detailed File Share subcategory (in the Object Access category) in Success mode in your audit policy.
After activating the audit policy, run bloodhound-python to observe the Event IDs generated during ingestion. For example:
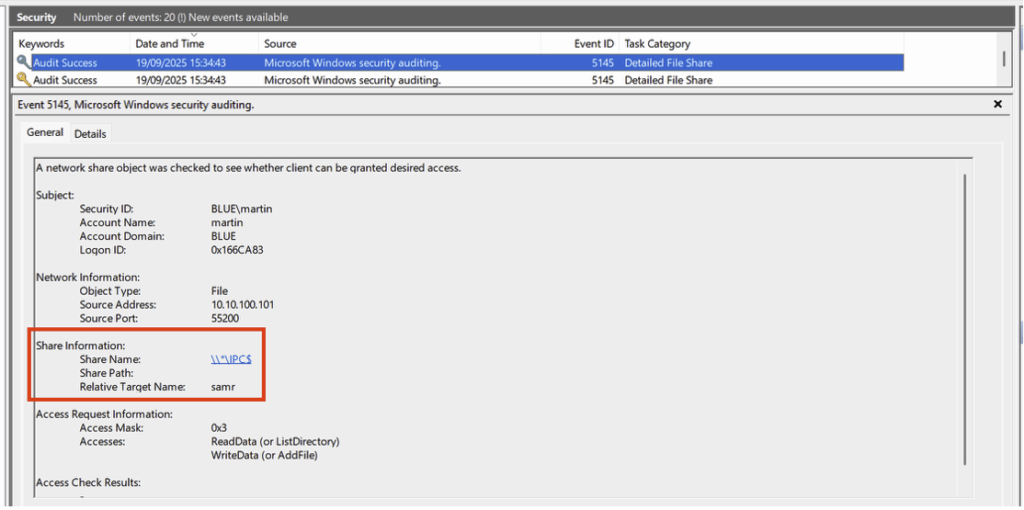
bloodhound-python -u 'martin' -p 'martin' -d blue.local -v --zip -c All -dc DC01.blue.local -ns 10.10.100.10After ingestion, we observe the generation of an Event ID 5140 corresponding to access to the IPC$ share, accompanied by a request to read the data.
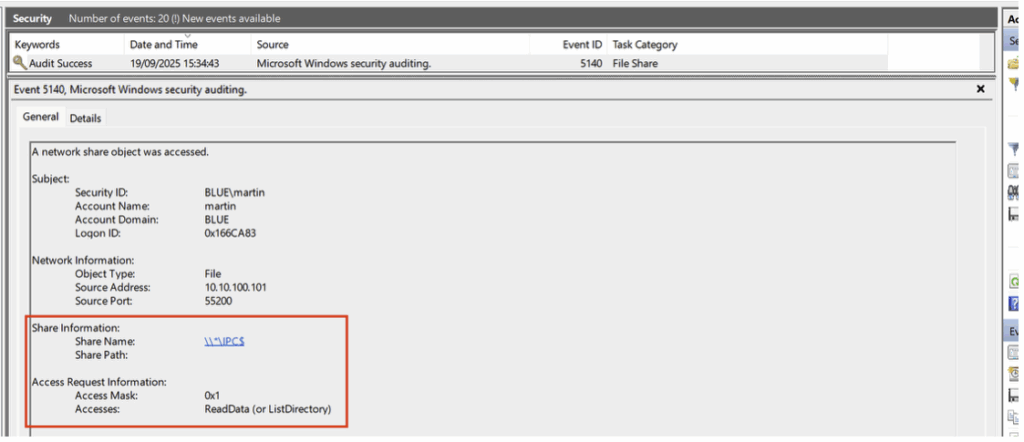
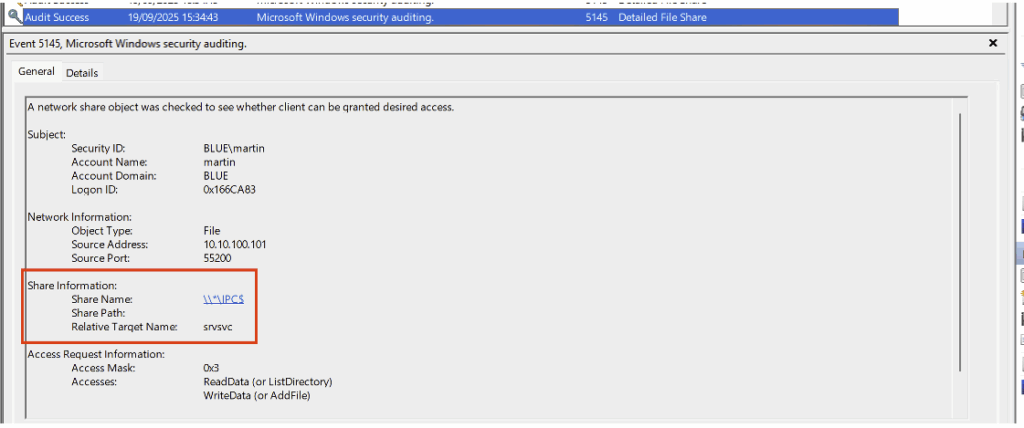
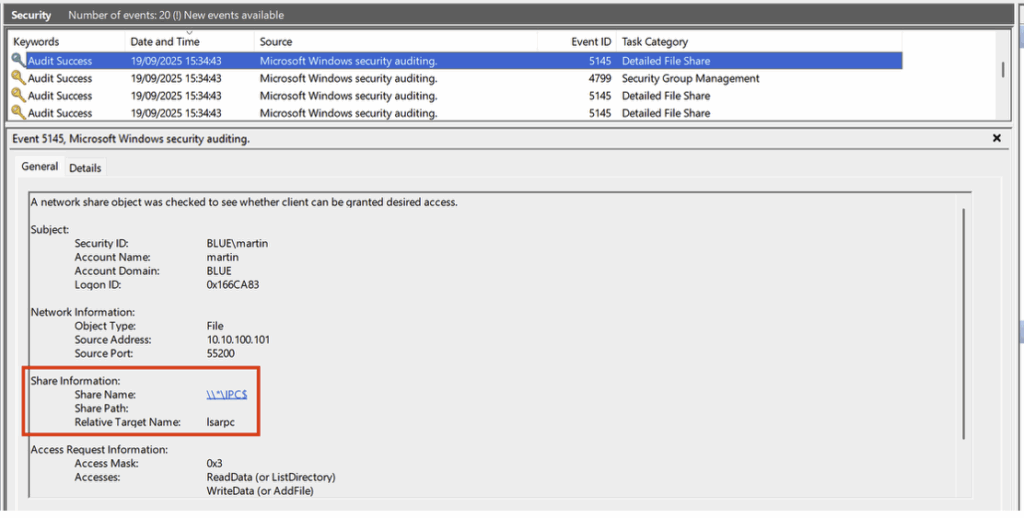
This event is followed by several Event ID 5145 events, also related to access to the IPC$ share. Each of these specifically targets different named pipes.
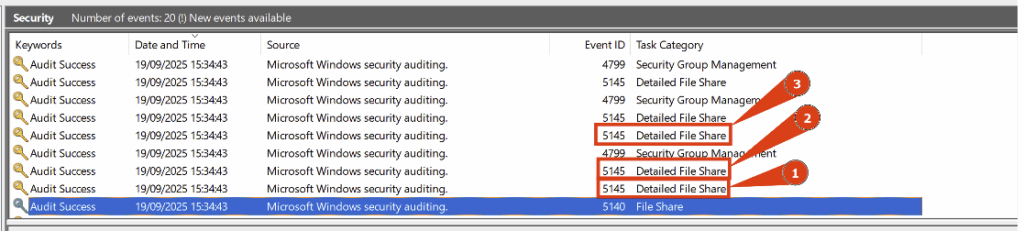
- Access to the named pipe srvsvc of the IPC$ share:
- Access to the named pipe samr of the IPC$ share:
- And access to the named pipe lsarpc of the IPC$ share:
To create the rule in ELK, we will take a minimalist approach, this time using the ES|QL language:
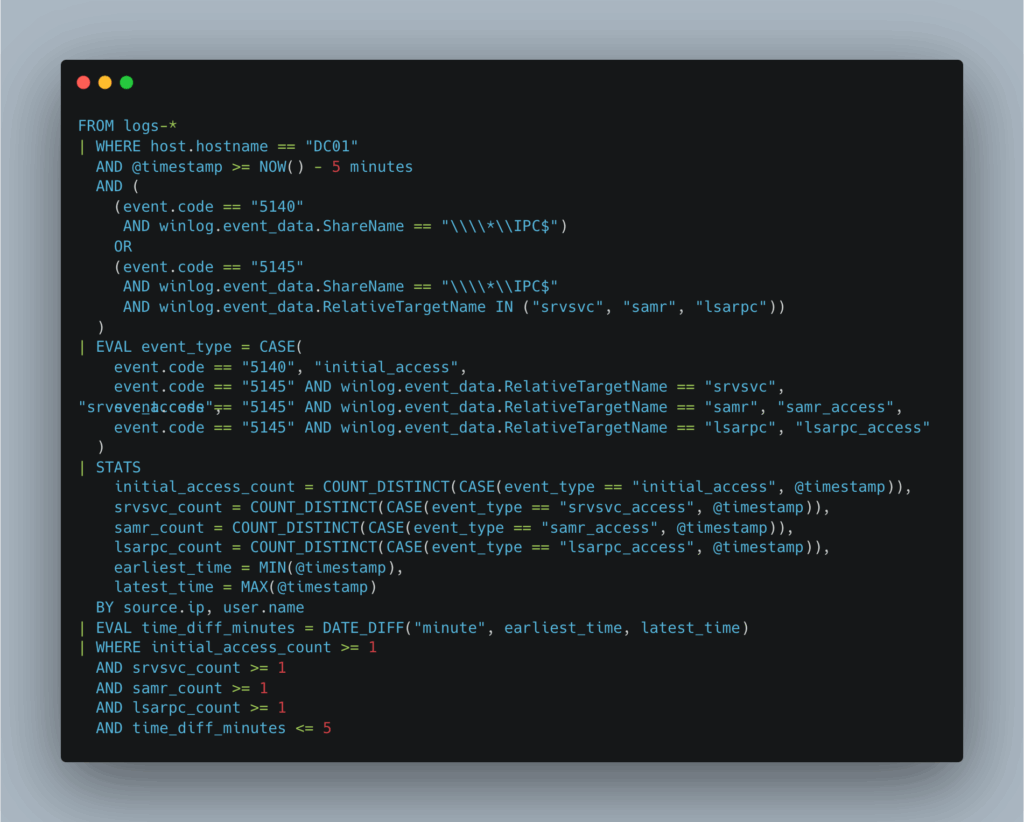
This rule monitors events associated with IPC$ sharing (5140) and named pipes (5145) over a 5-minute window. It looks for a characteristic sequence consisting of an initial connection to IPC$, followed by access to the named pipes srvsvc, samr, and lsarpc.
Events are aggregated by source IP address and user, and the time interval between the first and last accesses is calculated. Finally, the rule is only triggered if these four steps are observed within a short period of time.
Here is what the detection rule looks like in the SIEM:
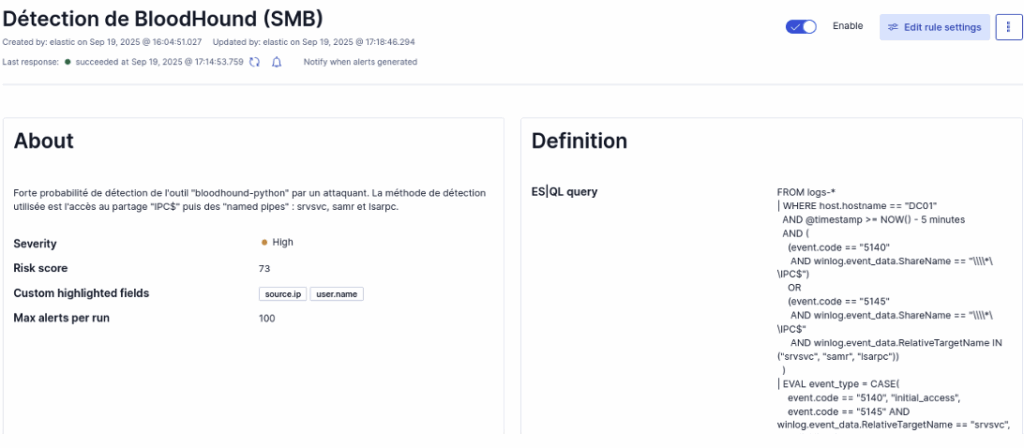
Once the rule has been added to ELK, we relaunch the attack from the attacking machine. In the dashboard, we can see that the rule has been triggered and has generated the expected alerts.
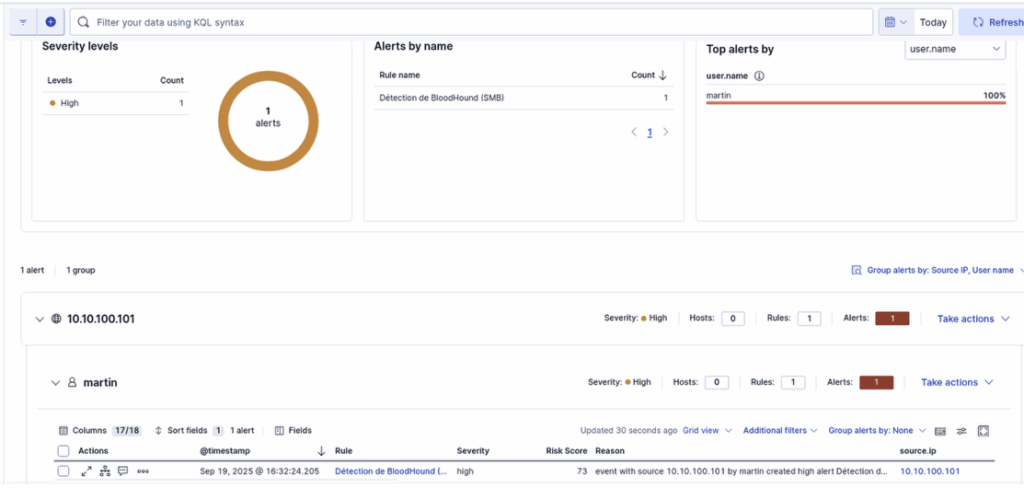
BloodHound detection via LDAP
Another method for detecting the use of bloodhound-python is to deploy an Active Directory decoy.
In our example, the principle is to create a decoy object (domain group, user, OU, etc.) and then correlate Event ID 4662 corresponding to read operations on this object when performed by an account or machine that is neither the domain administrator nor the domain controller, in order to reduce false positives.
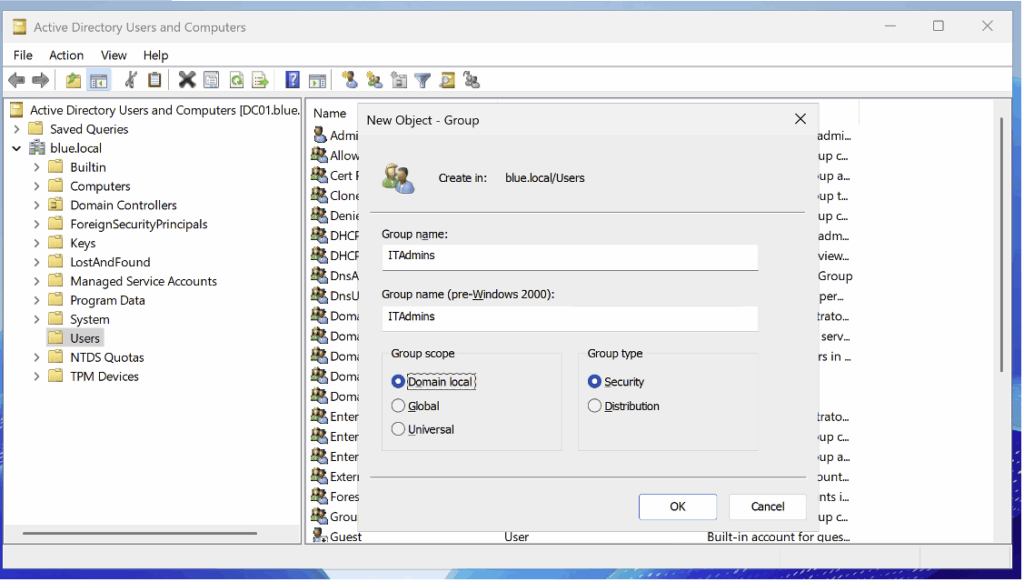
To implement this rule, we start by creating a domain group named ITAdmins.
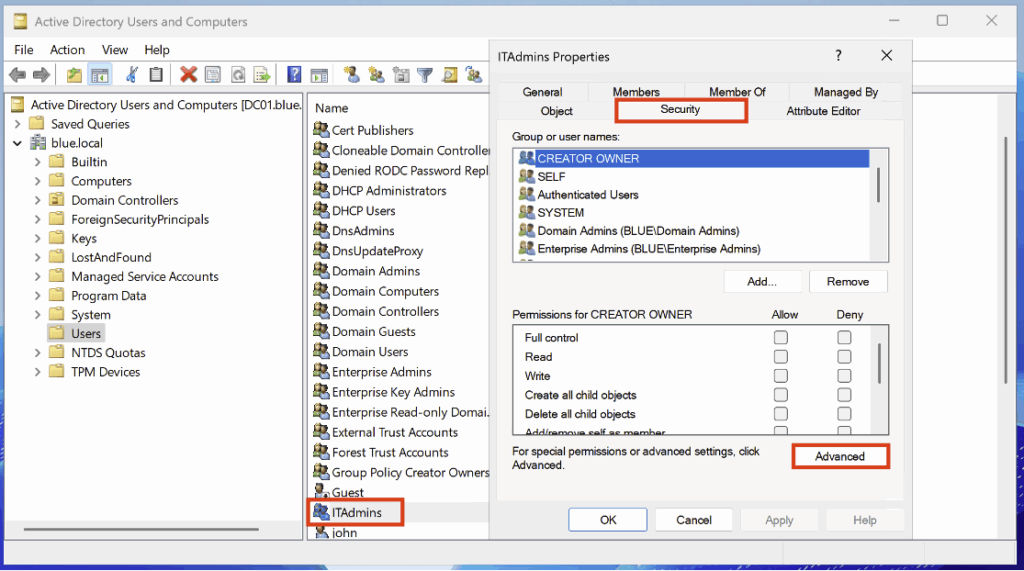
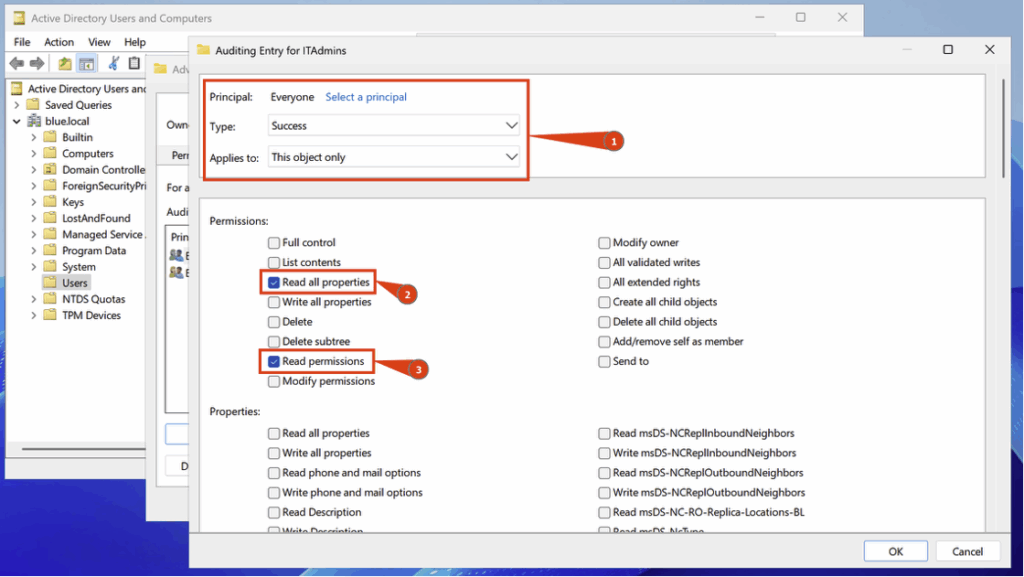
After creating the group, we will configure the security audit. To do this, go to Properties, then Security > Advanced:
In this new tab, go to the Auditing category to configure the settings.
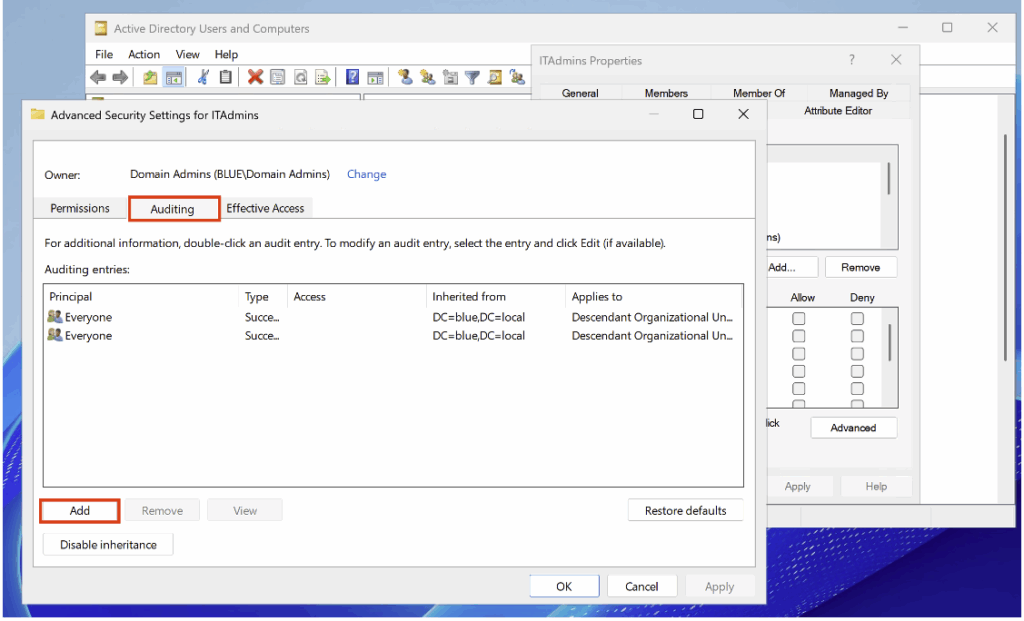
Then configure the following settings:
- Principal > Everyone
- Type > Success
- Applies to > This object only
You must also tick the following two boxes: Read all properties and Read permissions.
After configuring the domain group audit policy, we will launch bloodhound-python and verify that we have Event ID 4662:
bloodhound-python -u 'martin' -p 'martin' -d blue.local -v --zip -c All -dc DC01.blue.local -ns 10.10.100.10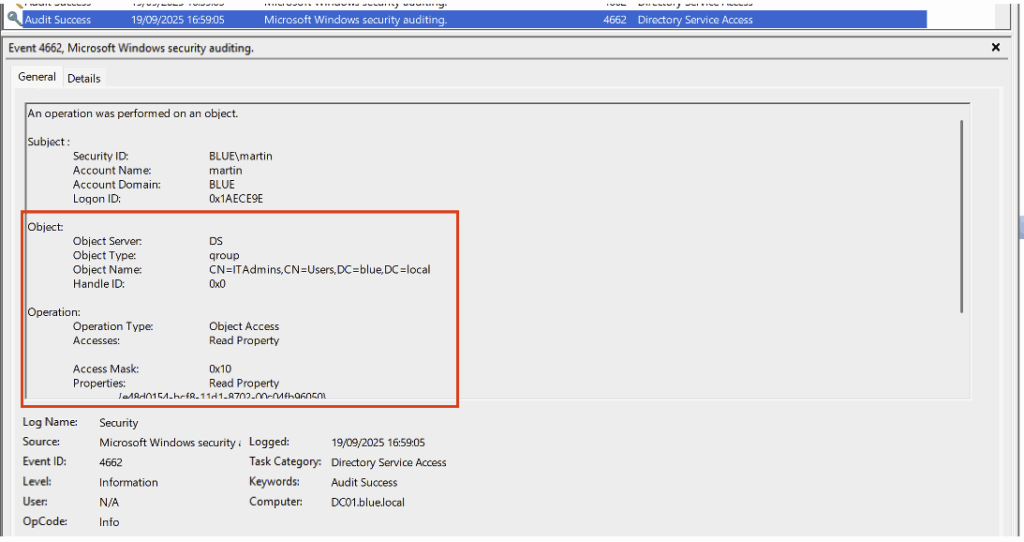
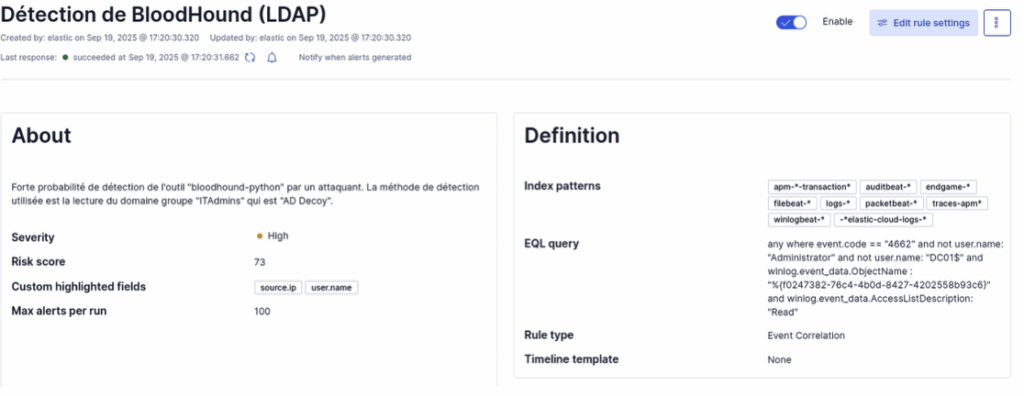
To create the rule in ELK, we will use the EQL language this time:
any where event.code == "4662" and not user.name: "Administrator" and not user.name: "DC01$" and winlog.event_data.ObjectName : "%{f0247382-76c4-4b0d-8427-4202558b93c6}" and winlog.event_data.AccessListDescription: "Read"This is what the detection rule looks like in the SIEM:
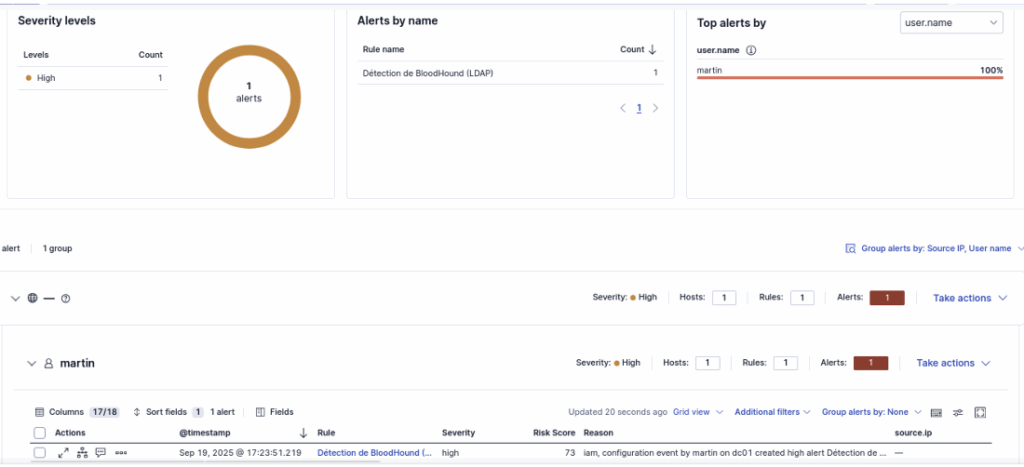
Once the rule has been added to our ELK, we try again to execute the attack with our attacking machine. We can clearly see in the Dashboard that the rule has been triggered:
Conclusion
This article shows that effective Active Directory monitoring relies on a multi-layered approach: domain controller auditing, workstation analysis, network collection and appropriate SIEM rules complement each other to provide robust visibility into LDAP activities and common offensive tactics. Fine-grained configuration of audit subcategories, targeted activation of SACLs, and enrichment with Sysmon or ETW traces enable raw events to be transformed into actionable indicators in ELK.
The implementation of custom ELK rules and the use of honeypots facilitate the detection of malicious behaviour and provide realistic test scenarios to validate the detection chain. However, it is essential to balance sensitivity and operational cost: overly verbose logging increases the load on controllers, SIEM and network infrastructure, while insufficient coverage leaves blind spots. Therefore, prioritise targeting critical objects and services, adjust thresholds according to your environment, and anticipate the impact on storage and processing.
Finally, AD monitoring is an iterative process: configure, test (with controlled simulations or Red Team exercises), correlate, and refine your rules and thresholds. By applying these principles, you will deploy a pragmatic, measurable detection posture tailored to the risks specific to your domain.
Authors: Alexis PARET – Pentester & Amin TRAORÉ – CMO @Vaadata