Traditional antivirus solutions are now facing increasingly effective evasion techniques. From payload obfuscation and shellcode encryption to the use of legitimate system tools (LOLBins), attackers have a wide range of methods at their disposal to bypass static detection mechanisms.
In the face of these evolving threats, Endpoint Detection and Response (EDR) solutions have established themselves as an essential component. Their ability to monitor system activity in real time enables them to detect suspicious behaviour far beyond simple malware signatures.
But how does an EDR manage to observe what is happening on a Windows machine? What mechanisms enable it to detect code injection, an attempt to steal credentials, or the execution of shellcode in memory? To answer these questions, we will explore the internal architecture of EDR solutions and the various telemetry sources they rely on to identify malicious activity.
An EDR (Endpoint Detection and Response) is a security solution designed to continuously monitor activity on the endpoints of an information system. Unlike traditional antivirus software, which relies primarily on the detection of known signatures, EDR solutions adopt a behavioural approach. Their aim is no longer simply to identify a malicious file, but to detect suspicious actions carried out on a machine in order to identify a compromise, even when no known malware is present on the drive.
This evolution has become necessary in the face of the modern techniques used by attackers. Payloads are frequently encrypted or obfuscated, legitimate Windows tools are hijacked for malicious purposes (LOLBins), and many attacks run exclusively in memory to limit the traces left on the system. In this context, simple file scanning is no longer sufficient. EDR solutions therefore collect a large amount of telemetry from the operating system to observe what processes are actually doing at the time of execution.
In practical terms, an EDR is capable of monitoring the creation of processes and threads, the loading of libraries into memory, access to sensitive processes, changes to the Windows registry, network connections and interactions between applications. These events are then correlated to identify behaviour characteristic of an attack, such as code injection, an attempt to extract credentials from LSASS, lateral movement, or the establishment of a command-and-control (C2) channel.
Beyond detection, EDR solutions also incorporate response capabilities to limit the impact of a compromise. Depending on the solution deployed, it is possible, for example, to isolate a machine from the network, suspend or terminate a malicious process, quarantine a file, or provide a detailed history of the events leading up to an incident.
A modern EDR agent is more than just a simple executable. It is divided into two main components that communicate constantly: one running in user mode and one in kernel mode.
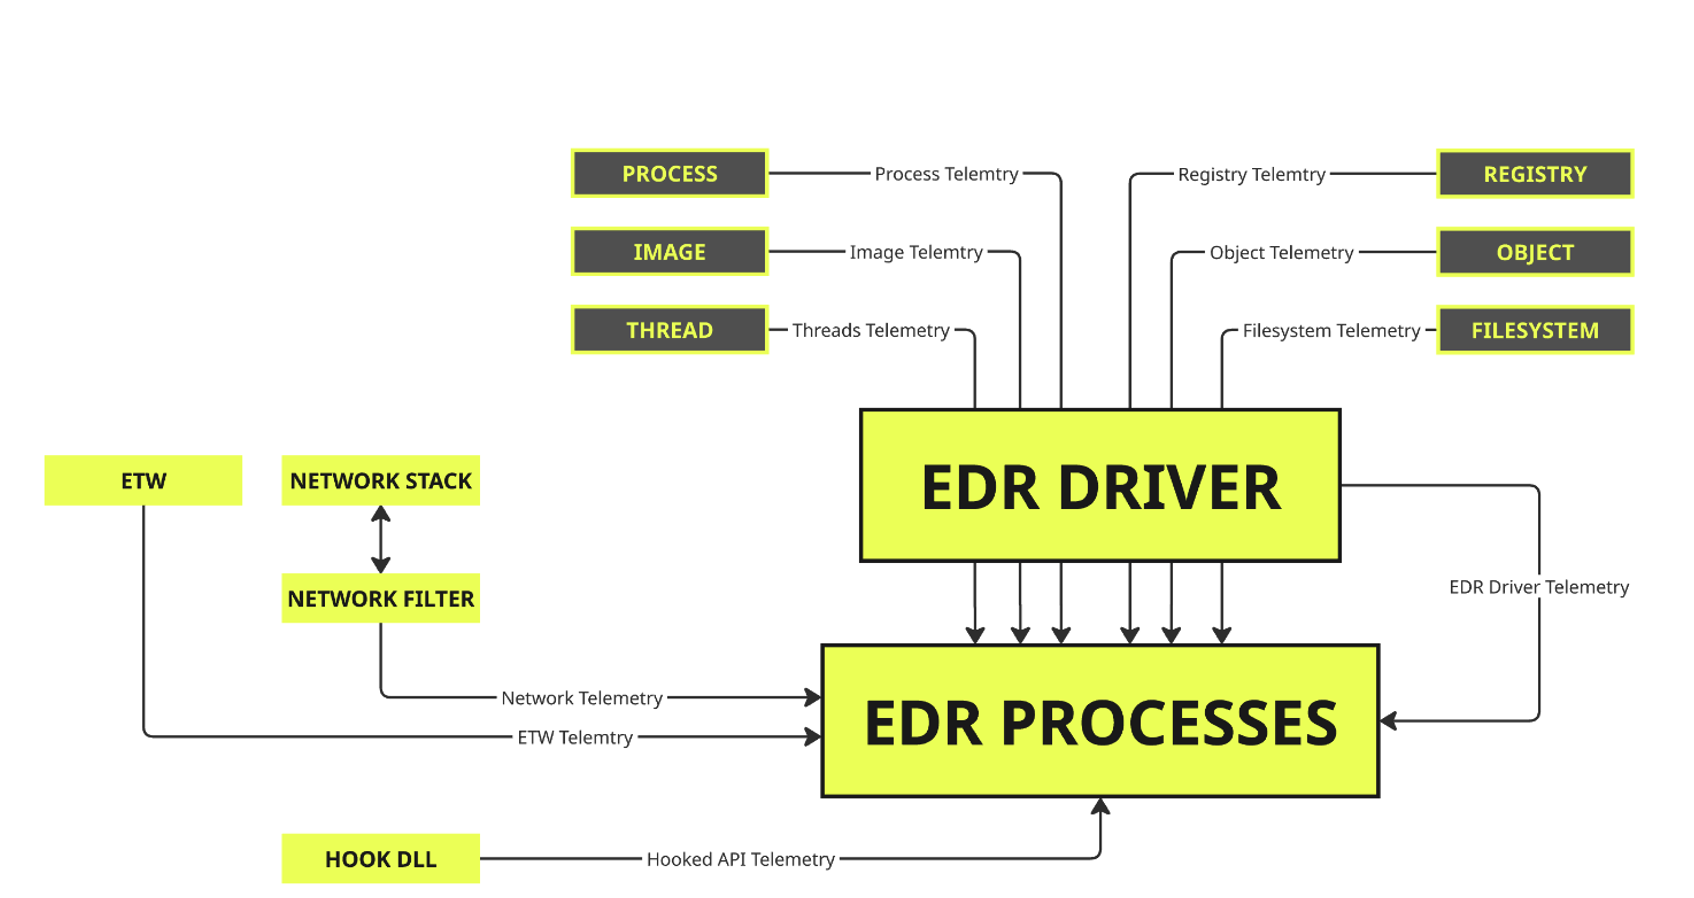
The user-mode component forms the first layer of monitoring in an EDR. It typically takes the form of a DLL injected into the majority of processes running on the system. Its primary purpose is to monitor interactions between applications and the operating system by intercepting certain sensitive calls.
To achieve this, EDRs frequently rely on API hooking techniques. Critical Windows functions, often within ‘ntdll.dll’, are hijacked so that the EDR can inspect the arguments passed before the system call is sent to the kernel. This visibility enables the monitoring of operations such as memory allocation, writing to a remote process, or loading dynamic libraries.
At the same time, a service running in the background centralises the collected telemetry, sends it to the management console and applies any necessary remediation measures. Depending on the defined policy, it may, for example, generate an alert, suspend or terminate a process, quarantine a file or isolate the machine from the network.
The kernel-mode component forms the core of an EDR’s monitoring mechanism. Running as a kernel driver with the highest system privileges (Ring 0), it has privileged visibility into critical operating system events.
Unlike the user-mode component, which primarily monitors interactions at the process level, the kernel driver can subscribe directly to the notification mechanisms provided by Windows. It is thus informed of the creation of processes and threads, the loading of images into memory, access to sensitive objects, and operations performed on the file system and the registry.
This privileged position enables the EDR to collect telemetry that is more reliable and harder to bypass than simple user-mode hooks. It is largely thanks to this component that EDR solutions can detect suspicious behaviour even when an attacker attempts to bypass the monitoring mechanisms present in user space.
The Windows kernel provides drivers with a notification mechanism known as callbacks. These callback points allow a component running in kernel mode, such as an EDR driver, to be automatically notified when a specific system event occurs.
By registering with these mechanisms, an EDR can monitor numerous critical operating system activities in real time, such as process creation, the loading of images into memory, access to sensitive objects, and changes to the Windows registry.
There are several types of callbacks, each dedicated to a particular category of events. Together, they constitute one of the main sources of telemetry utilised by modern EDRs to detect malicious behaviour.
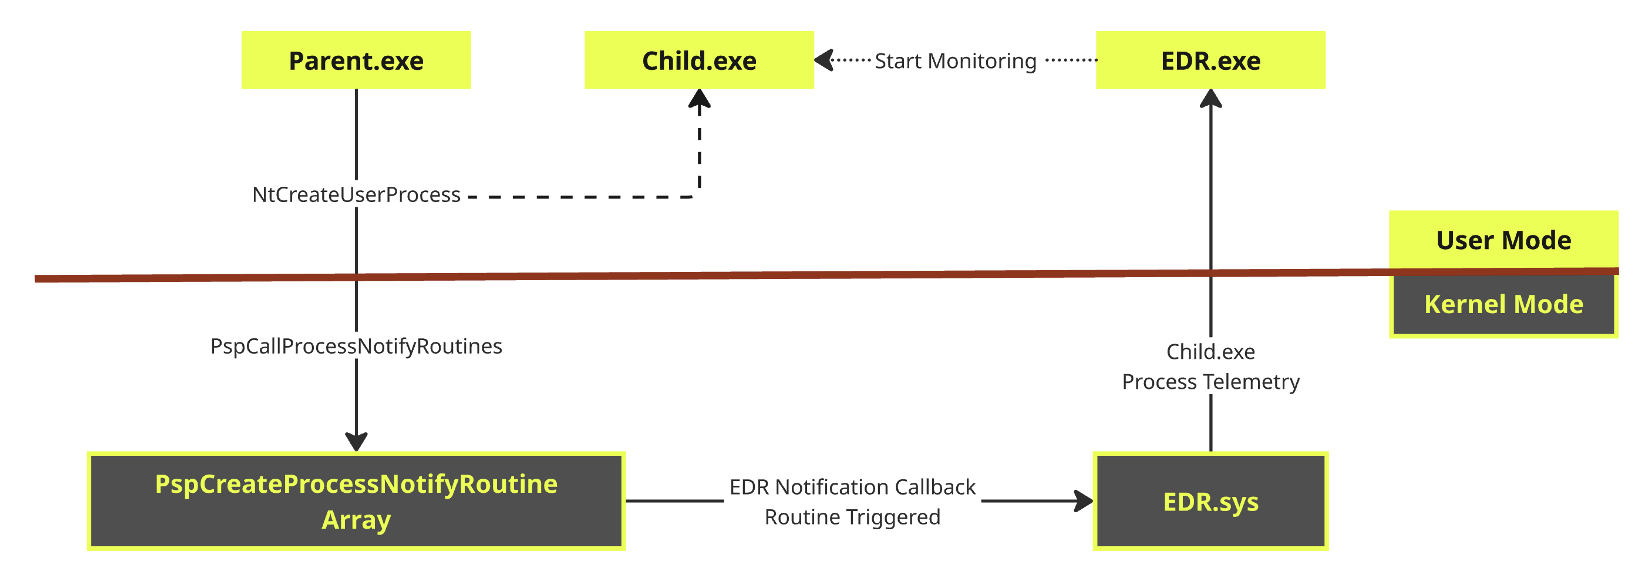
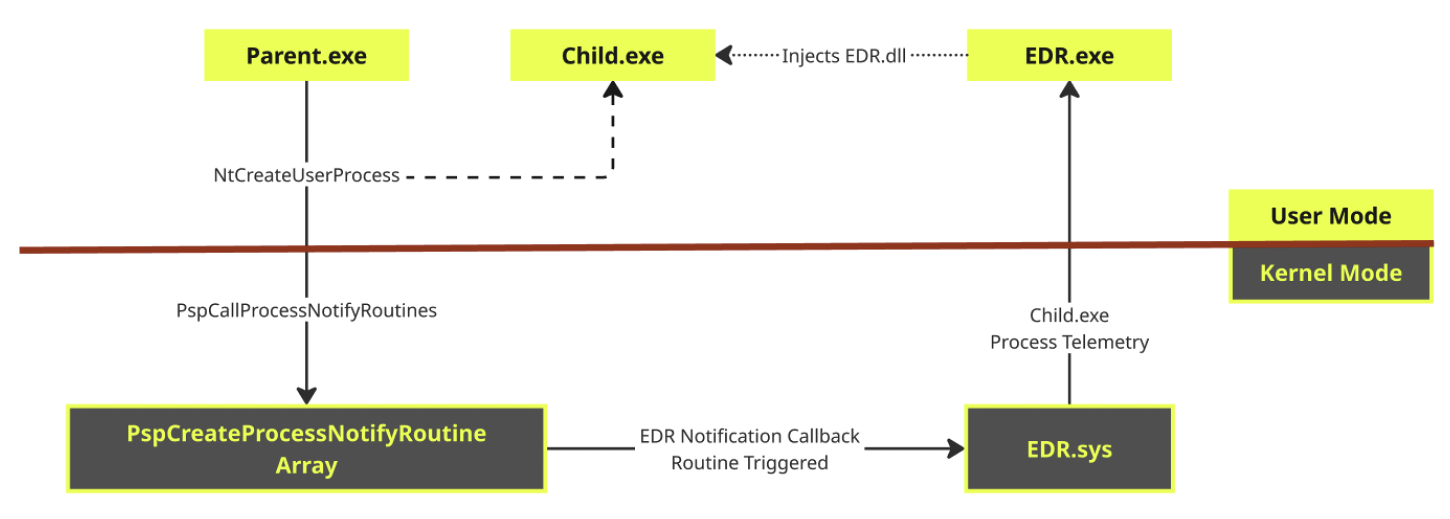
These callbacks notify the EDR driver whenever a process is created or terminated on the system. They are stored in the kernel array “nt!PspCreateProcessNotifyRoutine”, and drivers can register themselves there using the following APIs:
PsSetCreateProcessNotifyRoutine”PsSetCreateProcessNotifyRoutineEx”PsSetCreateProcessNotifyRoutineEx2”When a process is created from user space (for example, via “NtCreateUserProcess” or “NtCreateProcessEx”), the kernel calls the “PspCallProcessNotifyRoutines” function, which iterates through all registered callbacks and executes them.
This mechanism allows an EDR to immediately obtain information about the new process: process ID, parent process, executable path, creation context and launch arguments. This information constitutes an essential source of telemetry for detecting suspicious behaviour, such as the execution of a command interpreter from an Office application or the launch of an unexpected child process.
Process creation callbacks are also used by some EDRs to inject their user-mode component into the new processes they wish to monitor, in order to implement their hooking and telemetry collection mechanisms.
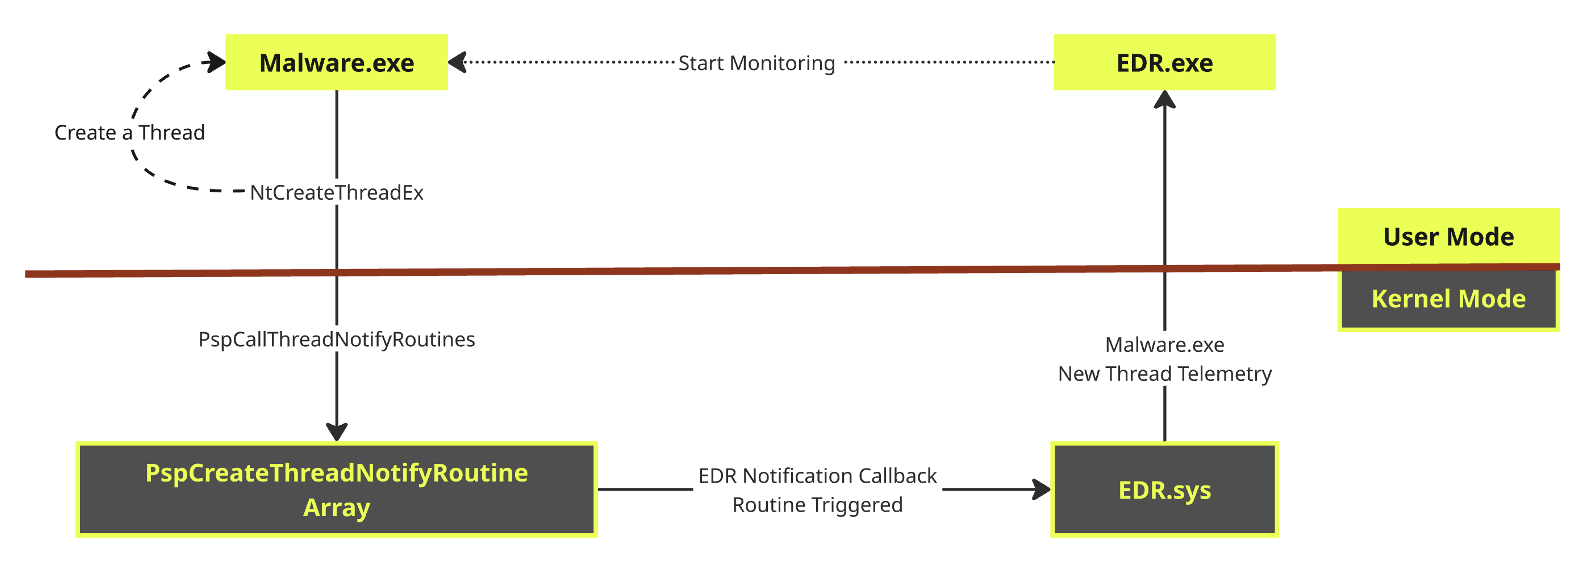
Similar to process creation callbacks, these routines are notified whenever a thread is created or terminated on the system. They are stored in the kernel array “nt!PspCreateThreadNotifyRoutine” and are registered via the “PsSetCreateThreadNotifyRoutine” and “PsSetCreateThreadNotifyRoutineEx” APIs.
Whilst Process Creation Callbacks allow the detection of new processes, Thread Creation Callbacks provide finer-grained visibility into the activities taking place within them. In particular, they enable the EDR to monitor thread creation within sensitive processes or to detect abnormal behaviour involving multiple processes.
This telemetry is particularly useful for identifying certain code injection techniques. For example, when a process creates a thread within another process via ‘NtCreateThreadEx’, the EDR can be notified of this event and correlate it with other suspicious actions, such as remote memory allocation or a call to ‘WriteProcessMemory’. This type of sequence is frequently observed during shellcode injection or the execution of payloads within a legitimate process.
These callbacks are triggered every time a PE image is loaded into memory, whether it is an executable (.exe), a dynamic library (.dll) or a driver (.sys). They are stored in the kernel array “nt!PspLoadImageNotifyRoutine” and are registered via the “PsSetLoadImageNotifyRoutine” API.
When an image is loaded via standard Windows mechanisms, for example via “LdrLoadDll” or “NtMapViewOfSection”, the kernel calls “PsCallImageNotifyRoutines” to notify all registered callbacks.
This telemetry enables the EDR to obtain valuable information about the modules loaded by processes: file path, load address, image type and execution context. EDR solutions can thus identify the loading of unsigned DLLs, libraries from unusual locations or modules loaded into sensitive processes.
Image Load Callbacks also provide significant visibility for detecting certain evasion or injection techniques that rely on the loading of malicious libraries. They are often correlated with other telemetry sources to identify suspicious behaviour within monitored processes.
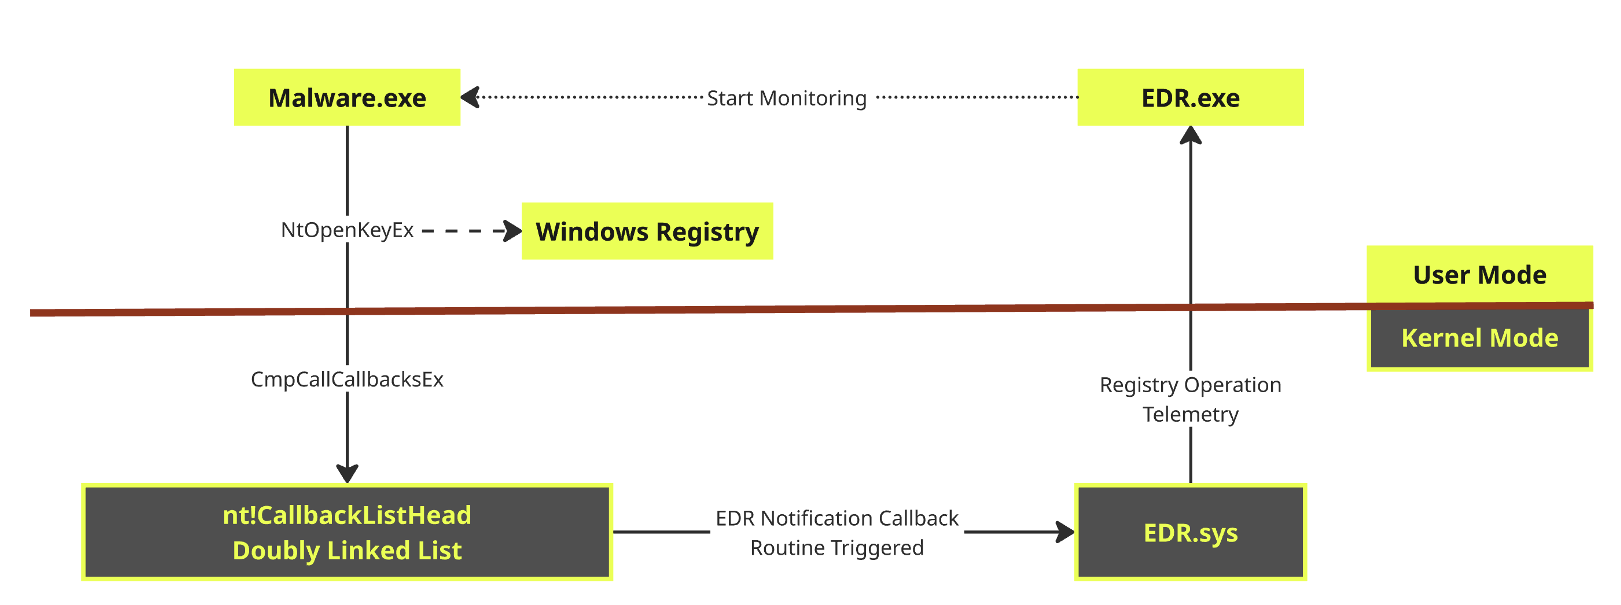
These callbacks enable the EDR driver to be notified of operations performed on the Windows registry, whether these are reads, writes, deletions or queries. The routines are registered via the ‘CmRegisterCallback’ or ‘CmRegisterCallbackEx’ APIs and are stored in a linked list headed by ‘nt!CallbackListHead’.
The monitored events are triggered by numerous kernel APIs, such as “NtOpenKeyEx”, “NtCreateKey”, “NtSetValueKey” and “NtDeleteKey”. For each operation, the callback receives information about the relevant key and the process that initiated the action.
This telemetry is particularly valuable for EDR solutions, as the Windows registry is frequently used by attackers to establish persistence or modify the system configuration. Detection solutions can thus monitor changes to sensitive registry keys such as the “Run” and “RunOnce” locations, Windows services, or certain system security settings.
By correlating these events with other telemetry sources, the EDR can detect suspicious behaviour indicative of a compromise or an attempt to maintain access to the machine.
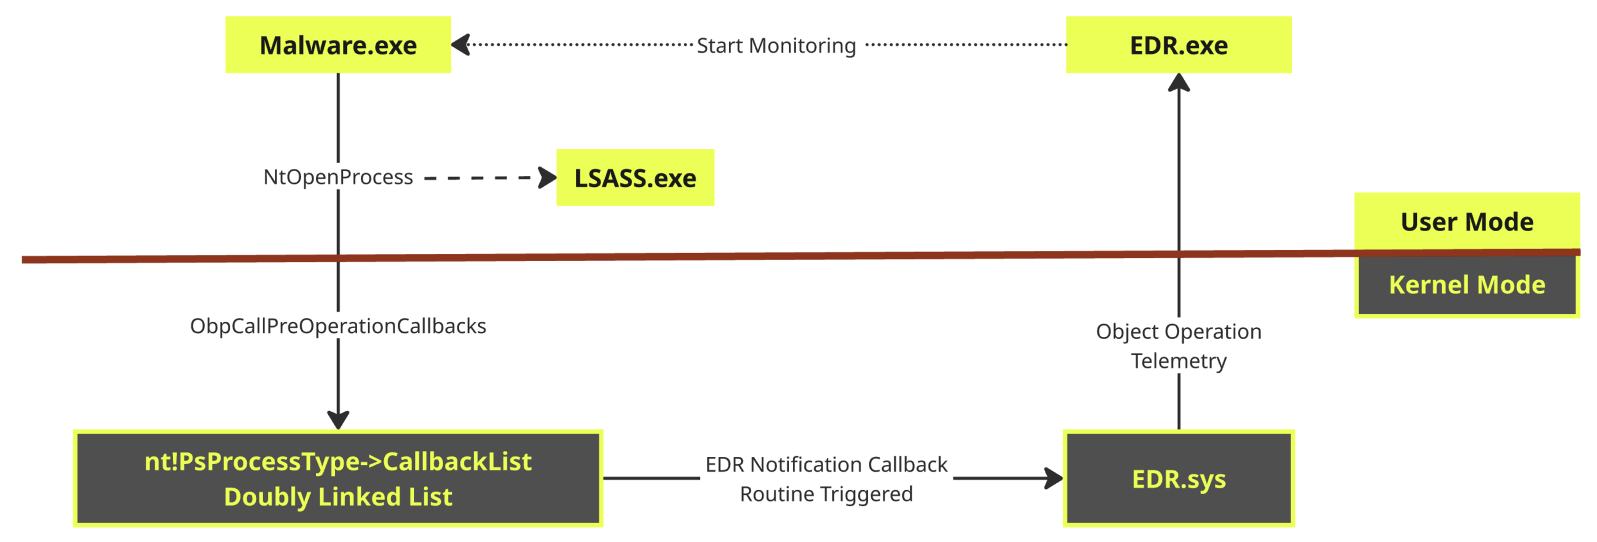
These callbacks allow the EDR to be notified when a process attempts to open or duplicate a handle to a process or thread. They are stored in the ‘nt!PsProcessType->CallbackList’ and ‘nt!PsThreadType->CallbackList’ lists and are registered via the ‘ObRegisterCallbacks’ API.
Notifications are triggered during operations such as “NtOpenProcess”, “NtOpenThread” or the duplication of handles. Before access is granted, the kernel calls the routines registered via “ObpCallPreOperationCallbacks”, thereby giving the EDR the ability to observe, modify or block the operation.
This mechanism is particularly important for protecting sensitive processes. For example, it enables the detection or prevention of attempts to open a handle to “lsass.exe” with rights allowing memory read access, a step frequently observed in attacks aimed at extracting credentials. Object Callbacks also play a key role in detecting remote code injection techniques, flagging suspicious access to third-party processes even before memory write operations or thread creation take place.
Thanks to their ability to intervene before access rights are actually granted, these callbacks constitute one of the most effective protection mechanisms utilised by modern EDRs.
Unlike previous callbacks, which rely on various Windows kernel notification mechanisms, file system monitoring generally relies on minifilter drivers. Registered with the Filter Manager via the ‘FltRegisterFilter’ API, these components enable the EDR to intercept operations performed on the file system.
Minifilters can define pre- and post-processing routines for numerous input/output (I/O) operations, such as creating, reading, writing, renaming or deleting files. This privileged position gives them complete visibility into interactions between processes and data stored on the disk.
This telemetry is particularly useful for detecting behaviours characteristic of certain threats. An EDR can, for example, identify ransomware by observing a large number of encryption operations carried out in a short space of time, or detect the writing of a suspicious executable to a sensitive system directory. Some products also use these mechanisms to block or quarantine files before they are executed.
Minifilters thus provide an essential source of visibility for monitoring file system activity and supplementing the information collected by other kernel telemetry mechanisms.
Kernel callbacks provide excellent visibility into system events, but they do not always allow easy access to the full context of an operation. To enhance their telemetry, EDR solutions also rely on monitoring mechanisms that run directly in user space.
The most common technique is userland hooking (or inline hooking):
The principle involves modifying the first instructions of certain critical functions in ‘ntdll.dll’, such as ‘NtAllocateVirtualMemory’, ‘NtWriteVirtualMemory’ or ‘NtProtectVirtualMemory’, in order to insert a jump to the EDR’s analysis code.
When a process calls one of these functions, execution is redirected to the hook. The EDR can then inspect the arguments passed, collect additional information about the current operation and feed its detection mechanisms before the system call is passed to the kernel.
This approach has a major advantage: it allows data to be observed exactly as it exists in the process’s memory. Encrypted shellcode or heavily obfuscated scripts must necessarily be decrypted before execution. By monitoring memory operations at this stage, the EDR can analyse the content after decryption, thereby significantly reducing the effectiveness of static obfuscation techniques.
However, this visibility remains limited to user space. An attacker can, for example, bypass certain hooks by directly invoking system calls (Direct Syscalls), which explains why EDRs generally combine this technique with the monitoring mechanisms present in the Windows kernel.
ETW (Event Tracing for Windows) is a logging mechanism built into Windows that collects events from the kernel, drivers and applications. Designed to be high-performance and minimally intrusive, it is widely used by administration, diagnostic and security tools to provide detailed visibility into system activity.
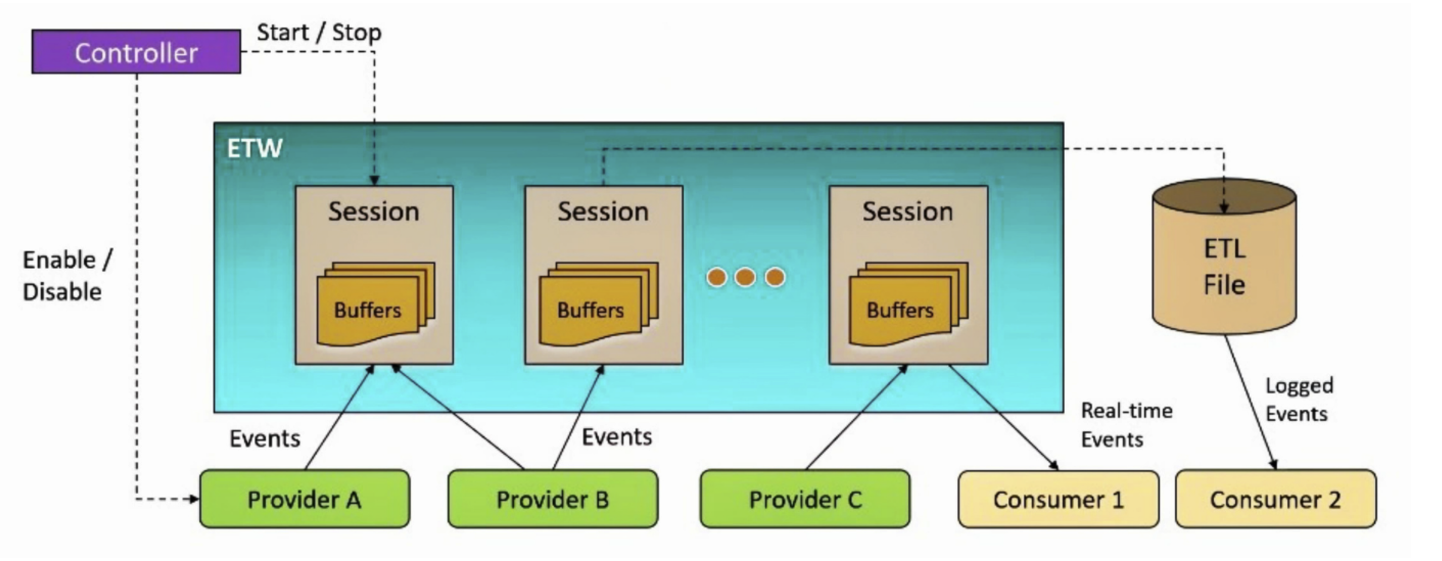
The ETW architecture is based on four main components:
Many security solutions utilise ETW to collect telemetry without having to instrument every system component themselves. However, traditional ETW has a significant limitation: an attacker with elevated privileges can potentially disable certain providers or disrupt their data collection in order to reduce the visibility of detection mechanisms.
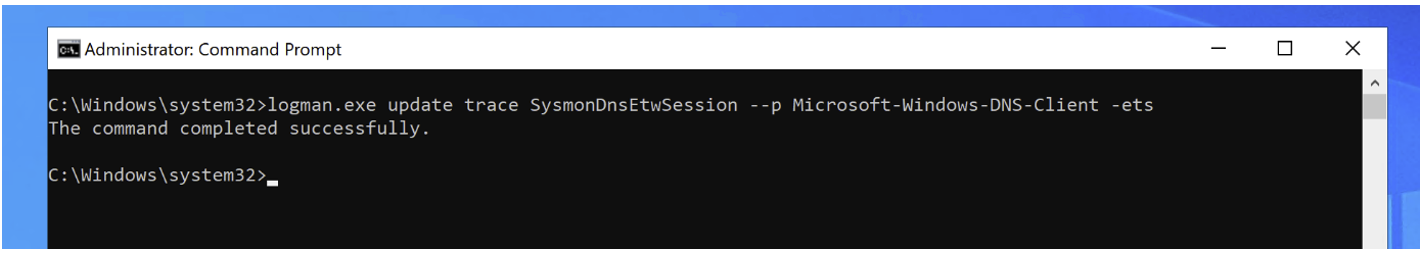
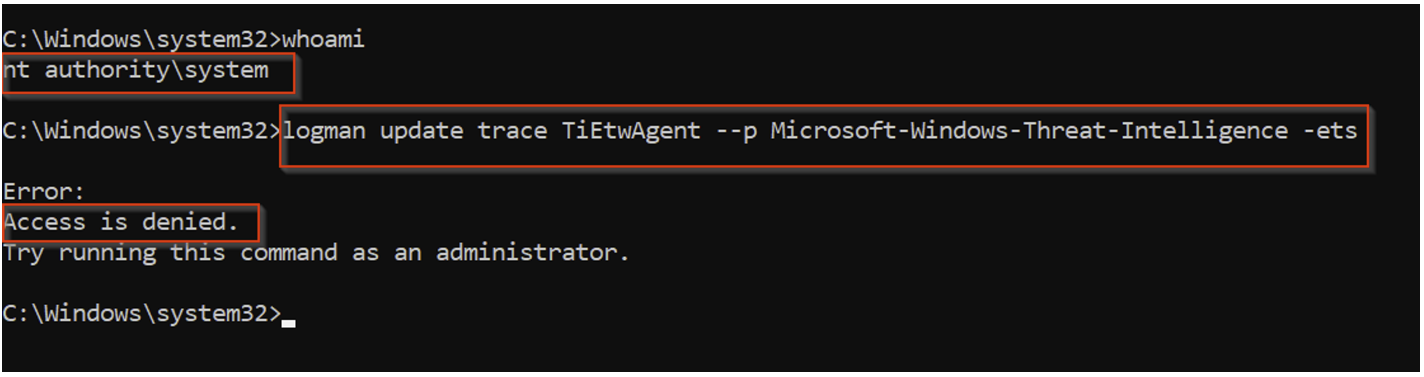
To address this issue, Microsoft has introduced the Microsoft-Windows-Threat-Intelligence (ETW-Ti) provider. Its distinctive feature is that it is protected by the Protected Process Light (PPL) mechanism. Only processes running with the PS_PROTECTED_ANTIMALWARE_LIGHT protection level can consume the events it generates.
Access to this protection level requires the use of an ELAM (Early Launch Anti-Malware) certificate issued by Microsoft to approved security solution vendors. In practice, a process running with SYSTEM privileges cannot simply subscribe to this provider or disable it from user space, making it a particularly reliable source of telemetry for EDR solutions.
Unlike traditional ETW providers, ETW-Ti is directly integrated into the Windows kernel. Microsoft has incorporated several specialised functions into ntoskrnl.exe that are called during sensitive operations:
| EtwTi function | Monitored operation | Related Syscall |
| EtwTiLogAllocExecVm | Executable memory allocation | NtAllocateVirtualMemory |
| EtwTiLogProtectExecVm | Changing memory permissions (RWX) | NtProtectVirtualMemory |
| EtwTiLogReadWriteVm | Reading from or writing to a remote process | NtRead/WriteVirtualMemory |
| EtwTiLogQueueUserApc | Injection via APC | NtQueueApcThread |
| EtwTiLogSetContextThread | Changing a thread’s context | NtSetContextThread |
These events correspond precisely to the primitives used by many code injection techniques. When a process modifies the memory of another process or attempts to execute code remotely, the EDR gains detailed visibility into the operation being performed and can correlate this information with other telemetry sources to identify malicious behaviour.
This approach is particularly effective against attacks relying on shellcodes, loaders or advanced injection techniques. Whereas a userland hook can be bypassed through the use of Direct Syscalls, ETW-Ti events are generated directly from the kernel and therefore remain visible to authorised security solutions.
Bypassing ETW-Ti generally requires obtaining kernel-mode execution (Ring 0). Attackers therefore frequently rely on BYOVD (Bring Your Own Vulnerable Driver) techniques to load a vulnerable driver and modify the system’s telemetry mechanisms. This constraint perfectly illustrates the philosophy of modern EDR: to multiply the layers of detection in order to progressively increase the cost and complexity of evasion techniques.
To ensure there are no blind spots, an EDR is based on three complementary pillars.
Introduced by Microsoft to enhance the analysis of content executed in memory, AMSI (Antimalware Scan Interface) is not a detection engine in the strict sense. It is a standardised interface that allows applications to send content to the security solution installed on the system for analysis.
The main benefit of AMSI is to combat the obfuscation techniques commonly used by attackers.
This approach is particularly effective because it allows the EDR to examine the content after it has been decrypted or deobfuscated. Even when a script has been heavily modified to evade conventional detection mechanisms, its actual logic must necessarily be revealed in plain text before it is executed.
Today, AMSI is natively integrated into several major components of the Windows ecosystem, including PowerShell, VBScript, JScript, VBA (Office macros) and the .NET framework, making it a particularly valuable source of telemetry for EDR solutions.
EDR solutions also monitor network communications initiated by processes running on the machine. This visibility enables a direct link to be established between network activity and the process that caused it, thereby providing valuable context for threat detection.
Beyond simply monitoring TCP or UDP connections, EDR solutions analyse numerous indicators such as DNS queries, domains contacted, remote IP addresses, ports used and the frequency of communications. This information is then correlated with the telemetry collected on the system.
This approach enables the identification of abnormal behaviour that would go unnoticed in a conventional network analysis. For example, a process such as ‘notepad.exe’ establishing an outbound TCP connection to the internet, or a PowerShell process making periodic communications to a remote infrastructure, may constitute indicators of a command-and-control (C2) channel.
By combining network events with information from kernel callbacks, API hooking or ETW-Ti, EDR is able to reconstruct the complete chain of an attack and accurately attribute suspicious network activity to the responsible process.
In addition to analysing system events, EDR solutions also inspect the memory state of processes in search of IoCs (Indicators of Compromise). This approach allows for the direct observation of artefacts left behind by an attack whilst it is in progress.
EDR solutions can thus identify suspicious memory regions, injected modules, threads executing code outside legitimate modules, or call stacks exhibiting inconsistencies. These indicators are frequently associated with techniques such as code injection, shellcode execution, or the loading of malicious libraries into memory.
This visibility is particularly valuable as it focuses on the actual state of the process at the time of execution. Unlike detection mechanisms based on file analysis, memory-based detection focuses on the final outcome of the attack: the code that is actually executing within the process, regardless of how it was deployed or concealed.
For this reason, memory analysis is among the most sophisticated detection mechanisms in modern EDRs and often constitutes one of the last lines of defence against advanced evasion techniques.
Despite their advanced level of visibility, EDR solutions are not foolproof. Like any security mechanism, their detection capabilities can be circumvented or compromised by attackers with sufficient knowledge and privileges.
Modern evasion techniques generally target the various telemetry sources utilised by EDR solutions. Among the best-known approaches are the use of Direct Syscalls to bypass userland hooks, Bring Your Own Vulnerable Driver (BYOVD) attacks enabling execution in kernel mode, and deactivation mechanisms targeting specific security components.
However, the strength of modern EDRs lies precisely in the proliferation of detection layers. Bypassing a single monitoring mechanism is generally not enough: the attacker must neutralise several telemetry sources simultaneously to significantly reduce the solution’s detection capabilities.
For a detailed analysis of the main techniques used to bypass antivirus and EDR solutions, see our dedicated article: Antivirus and EDR bypass techniques.
Author: Alexis PARET – Pentester @Vaadata


